Fig. 4
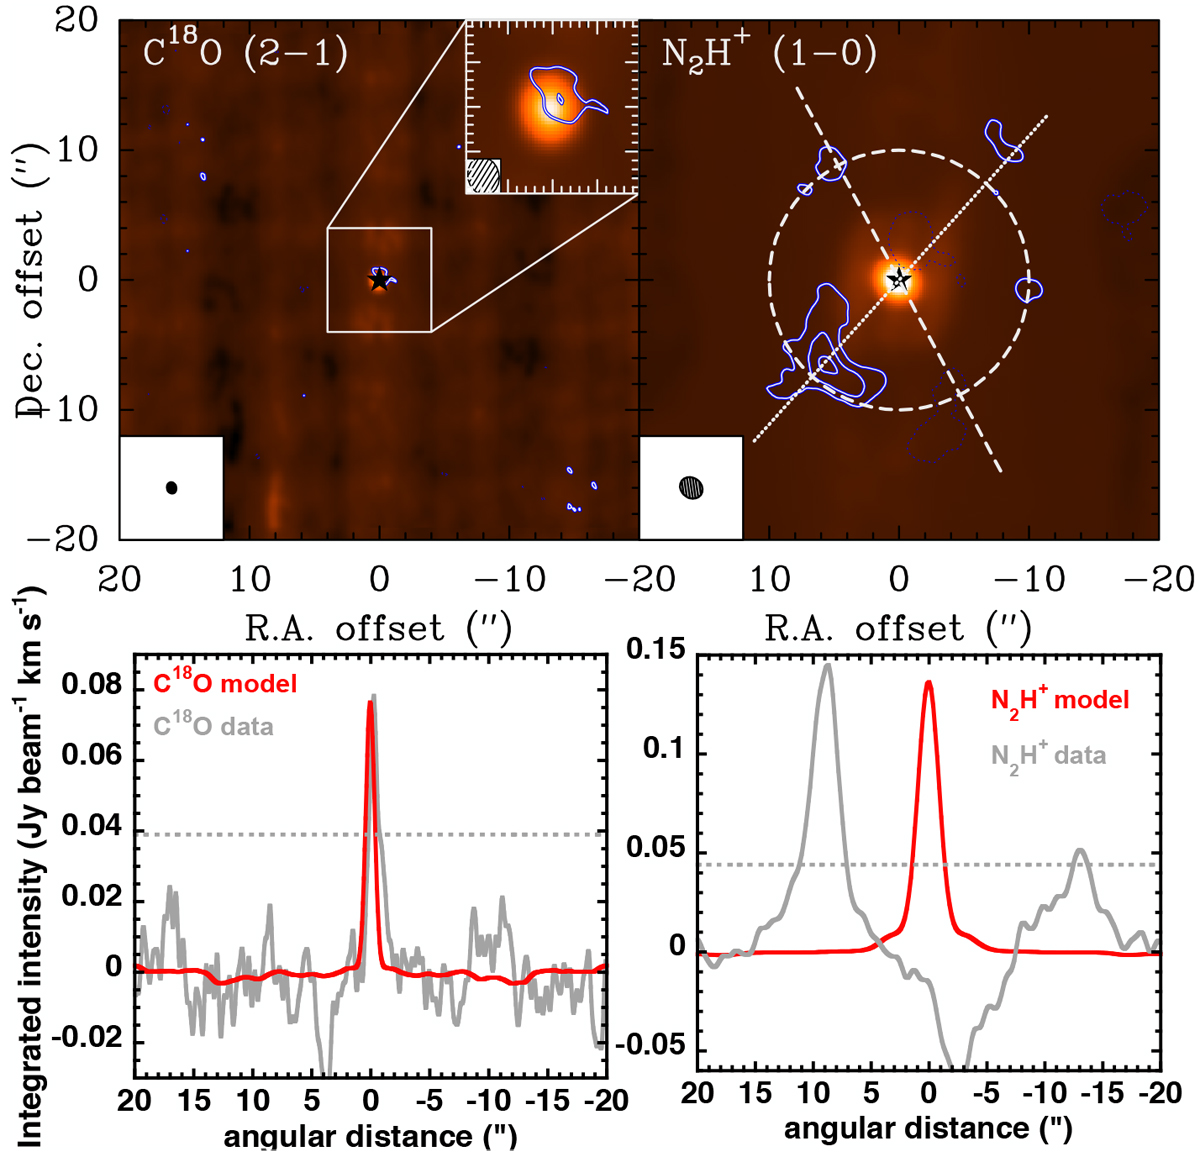
Constant low-luminosity model (Model1). Top row: comparison of the observations (contours) with the synthetic maps (color background). Top left: C18O (2–1). The inlay in the upper right corner of the left map shows a zoom into the C18 O emission within the central 2″. Right: N2H+ (1–0); integration intervals are the same as in Fig. 1, while the contour spacing is in steps of 3σ, starting at 3σ. The dotted line shows the direction of the cuts through the maps, while the dashed line illustrates the outflow direction. The white dashed circle marks a radius of 10″. The scalingof the maps can be understood in comparison with the cuts in the bottom row. Bottom row: cuts at PA = 138° for C18 O (left) and N2H+ (right). Gray lines show the data, red lines the model, and the dotted gray lines show the 3σ.
Current usage metrics show cumulative count of Article Views (full-text article views including HTML views, PDF and ePub downloads, according to the available data) and Abstracts Views on Vision4Press platform.
Data correspond to usage on the plateform after 2015. The current usage metrics is available 48-96 hours after online publication and is updated daily on week days.
Initial download of the metrics may take a while.