Press Release
Open Access
Fig. 2
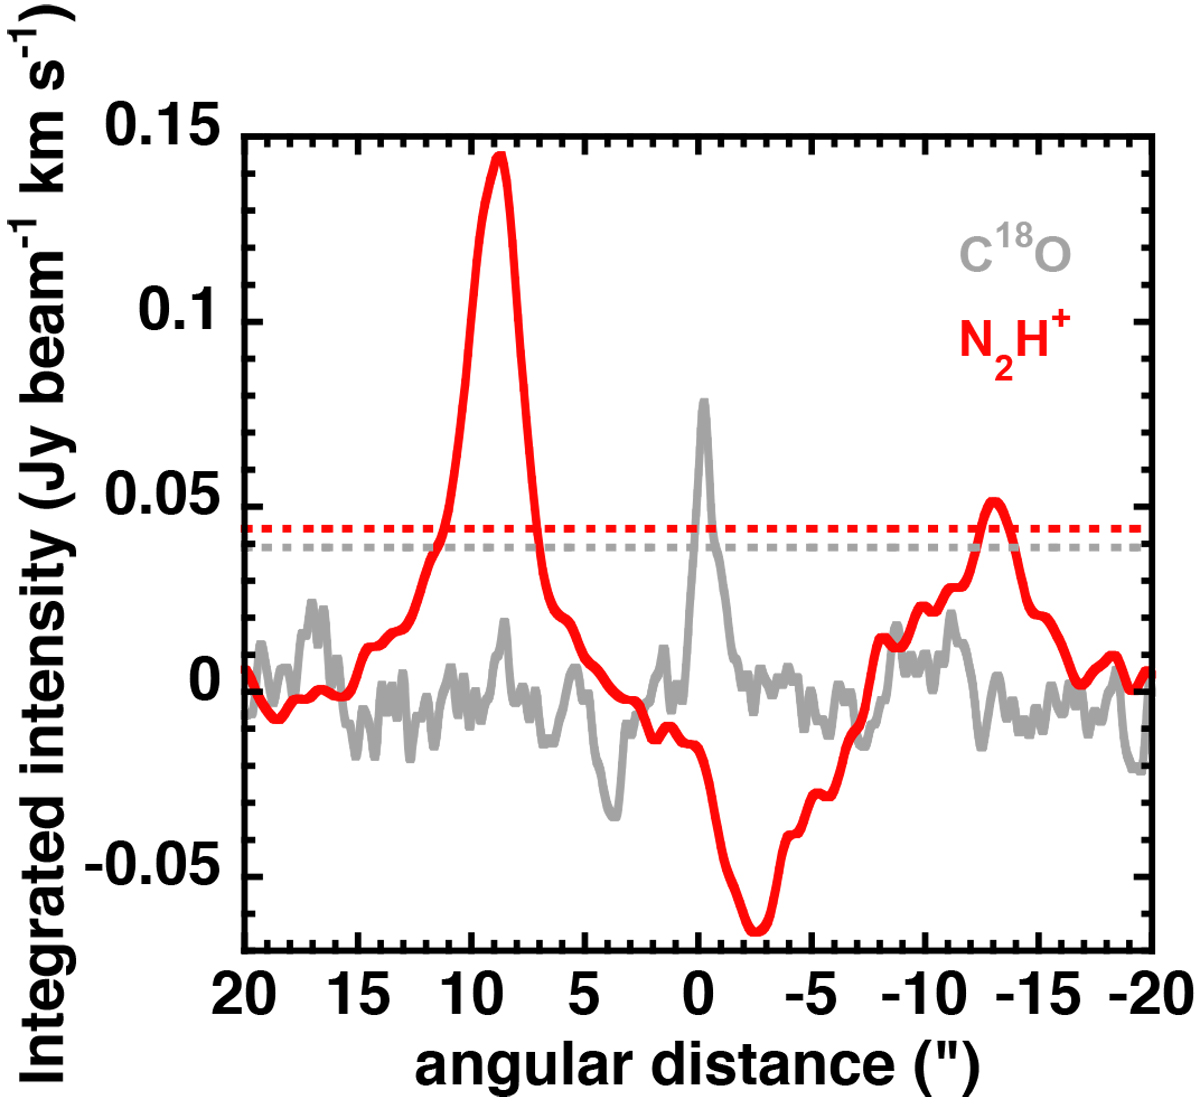
Cuts in the image plane through the southeastern N2H+ emission peak (PA = 138°) for C18 O (gray) and N2H+ (red) with corresponding 3σ-levels (dotted lines).
Current usage metrics show cumulative count of Article Views (full-text article views including HTML views, PDF and ePub downloads, according to the available data) and Abstracts Views on Vision4Press platform.
Data correspond to usage on the plateform after 2015. The current usage metrics is available 48-96 hours after online publication and is updated daily on week days.
Initial download of the metrics may take a while.