Fig. B.1
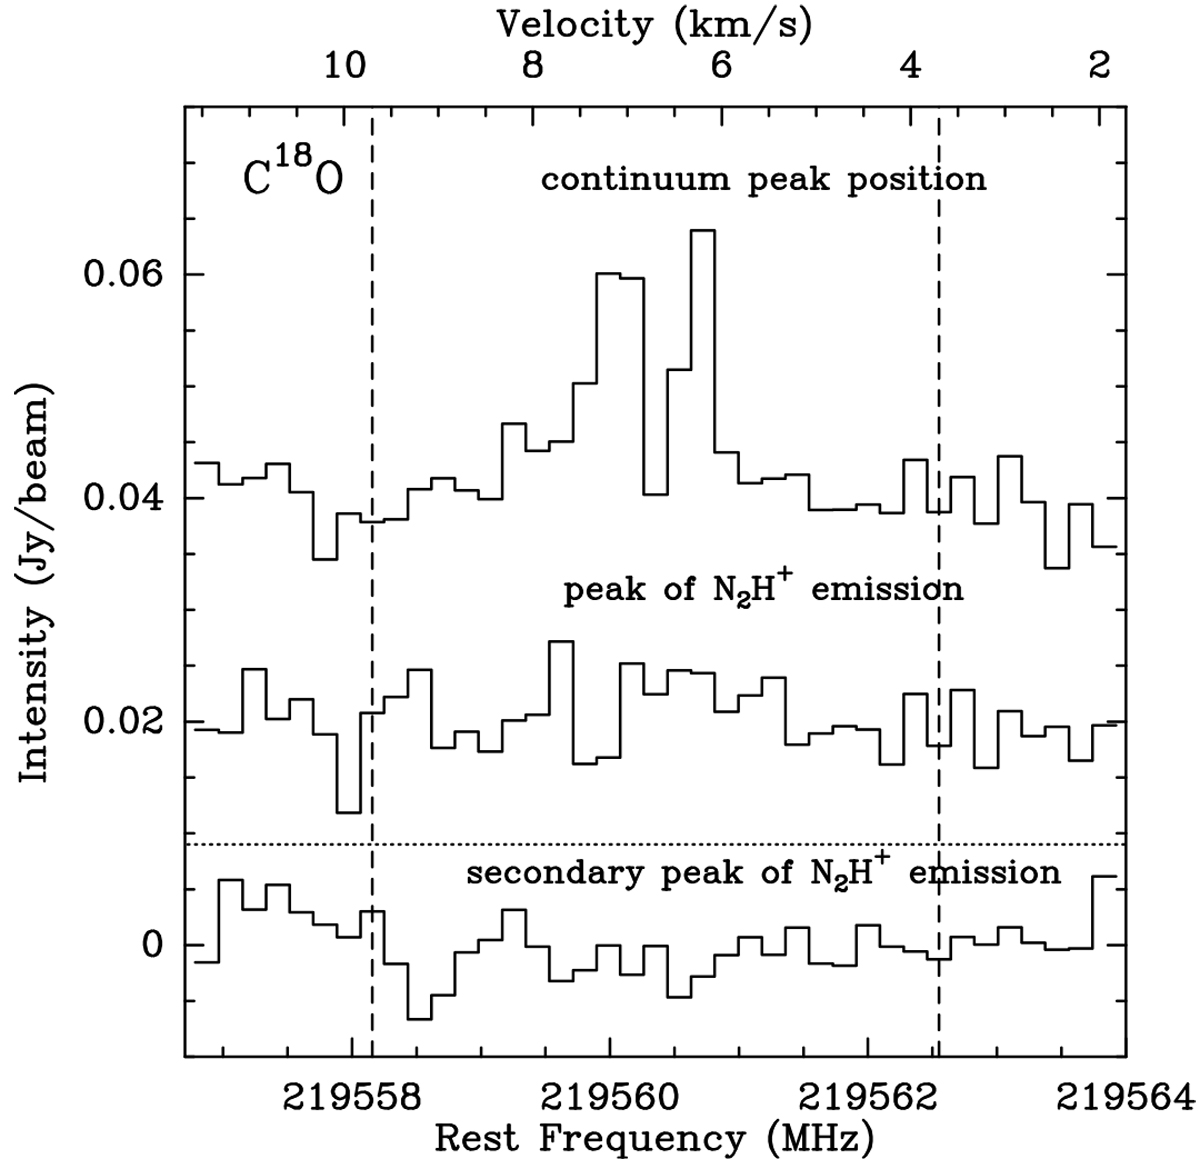
Spectra of C18O (2–1) at the continuum peak position (top) and at the main (middle) and secondary peaks (bottom) of N2H+ emission. The top and middle spectra are shifted vertically for clarity. The dashed lines indicate the velocity interval used for computing the integrated intensity. The dotted line shows the 3σ level (1σ = 3.0 mJy beam−1).
Current usage metrics show cumulative count of Article Views (full-text article views including HTML views, PDF and ePub downloads, according to the available data) and Abstracts Views on Vision4Press platform.
Data correspond to usage on the plateform after 2015. The current usage metrics is available 48-96 hours after online publication and is updated daily on week days.
Initial download of the metrics may take a while.