Fig. 7.
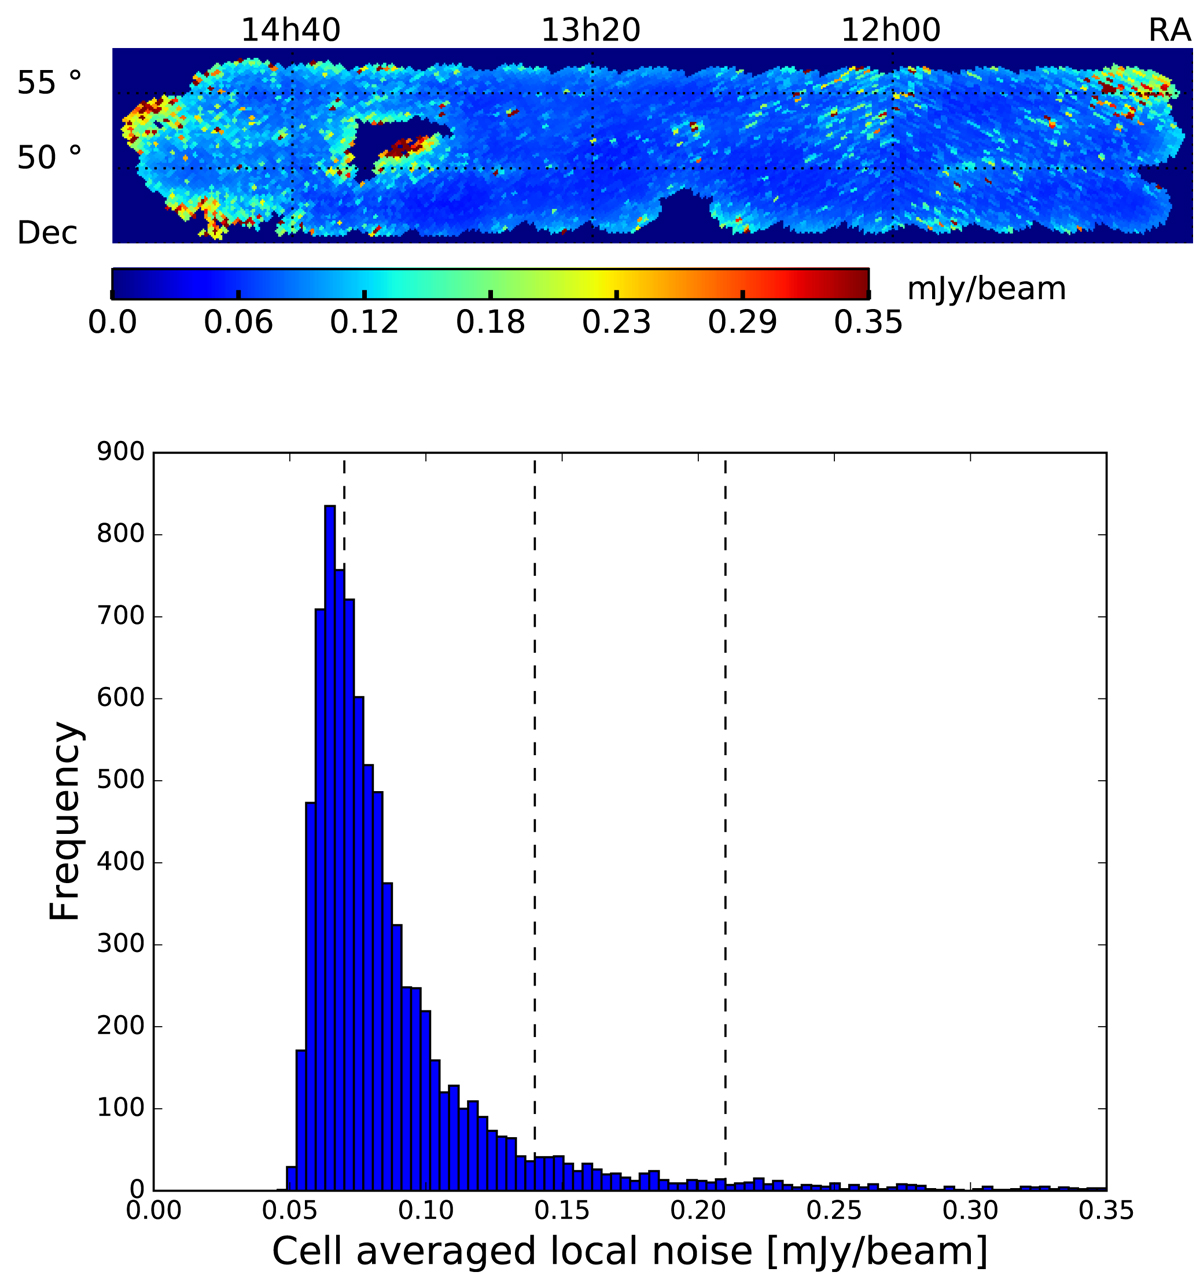
Local rms noise per HEALPIX cell, calculated via the mean of the local rms around each LoTSS-DR1 radio source. The heat map (top) and histogram (bottom) of the local rms is clipped at an upper limit of five times the median rms noise. The median rms noise of 0.07 mJy beam−1, as well as the values of two and three times the median rms noise are marked in the histogram with black dashed lines.
Current usage metrics show cumulative count of Article Views (full-text article views including HTML views, PDF and ePub downloads, according to the available data) and Abstracts Views on Vision4Press platform.
Data correspond to usage on the plateform after 2015. The current usage metrics is available 48-96 hours after online publication and is updated daily on week days.
Initial download of the metrics may take a while.