Fig. 4.
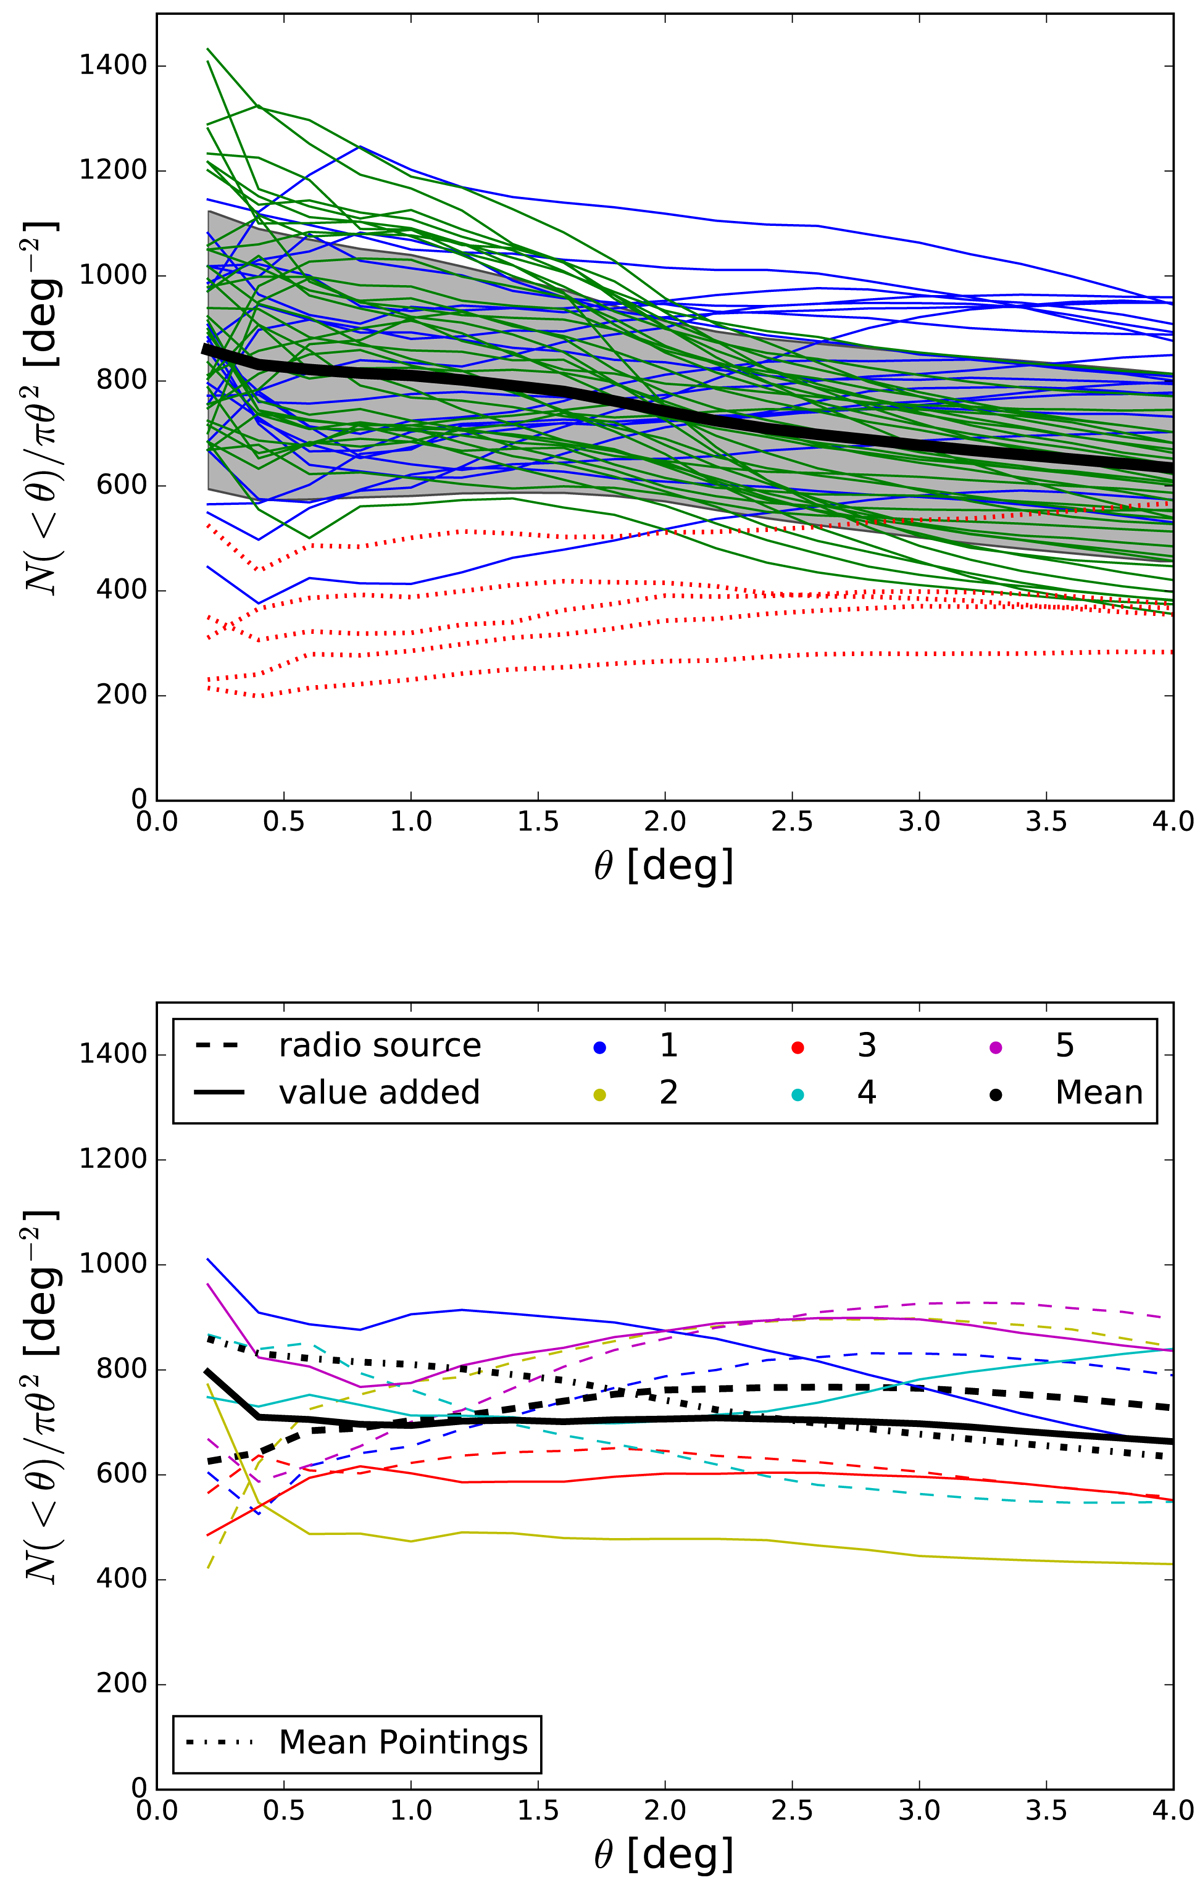
Top: source counts for each pointing within angular distance θ around the pointing centre, normalised by covered area. Pointings are classified by position in the HETDEX field, with pointings on the edge (green), in the inner field (blue) and undersampled ones (red, dotted). The mean is shown in black with standard deviation (grey band) of all pointings. Bottom: source counts around the five brightest radio sources in terms of integrated flux density from the radio source (dashed lines) and value-added source catalogue (solid lines). The mean number counts around the five brightest sources are shown in black for both catalogues and additionally also the mean over all pointings (dash dotted).
Current usage metrics show cumulative count of Article Views (full-text article views including HTML views, PDF and ePub downloads, according to the available data) and Abstracts Views on Vision4Press platform.
Data correspond to usage on the plateform after 2015. The current usage metrics is available 48-96 hours after online publication and is updated daily on week days.
Initial download of the metrics may take a while.