Fig. A.2.
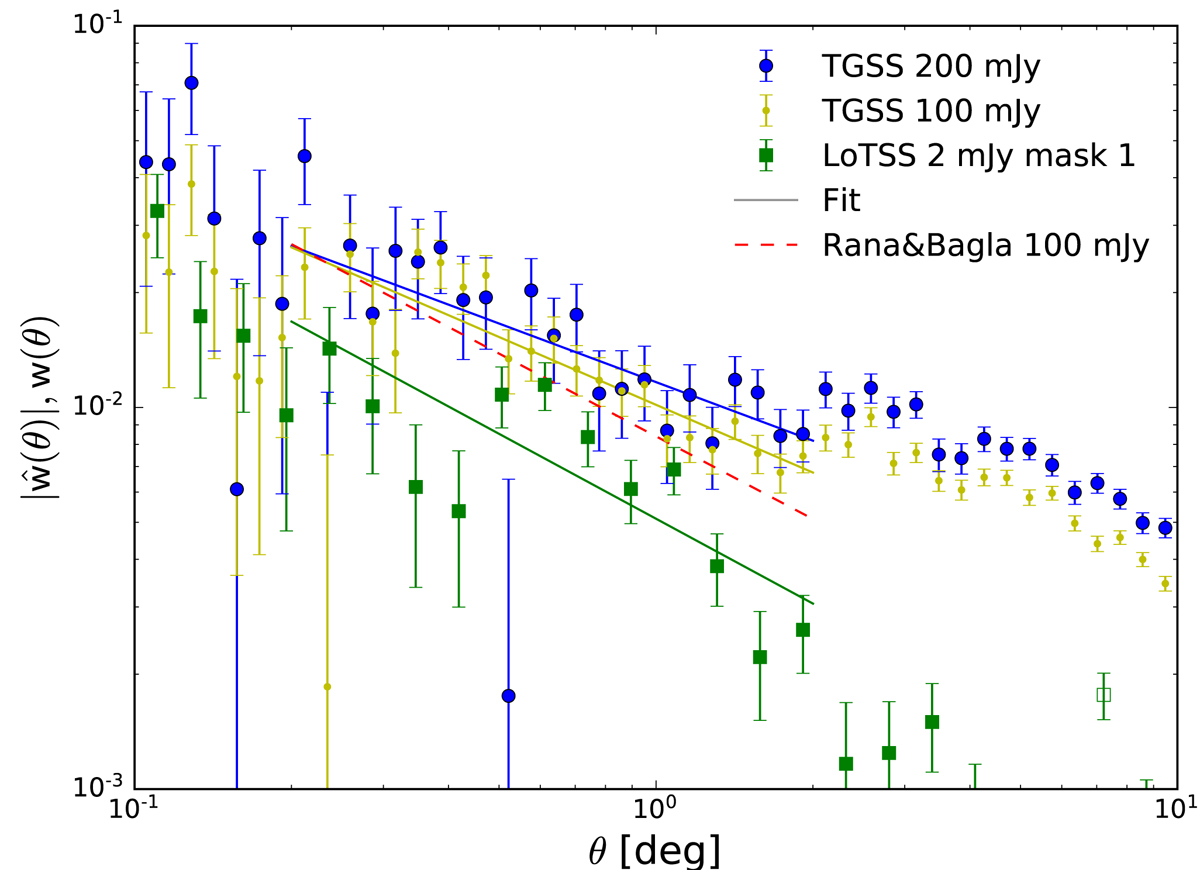
Comparison of the two-point correlation function w(θ) for the TGSS-ADR1 source catalogue for different flux density thresholds and for the LoTSS-DR1 value-added source catalogue. The errors shown are estimates by means of TREECORR and represent just statistical errors. We fitted w(θ) by a power-law in the range 0.2 deg ≤θ ≤ 2 deg.
Current usage metrics show cumulative count of Article Views (full-text article views including HTML views, PDF and ePub downloads, according to the available data) and Abstracts Views on Vision4Press platform.
Data correspond to usage on the plateform after 2015. The current usage metrics is available 48-96 hours after online publication and is updated daily on week days.
Initial download of the metrics may take a while.