Fig. 23.
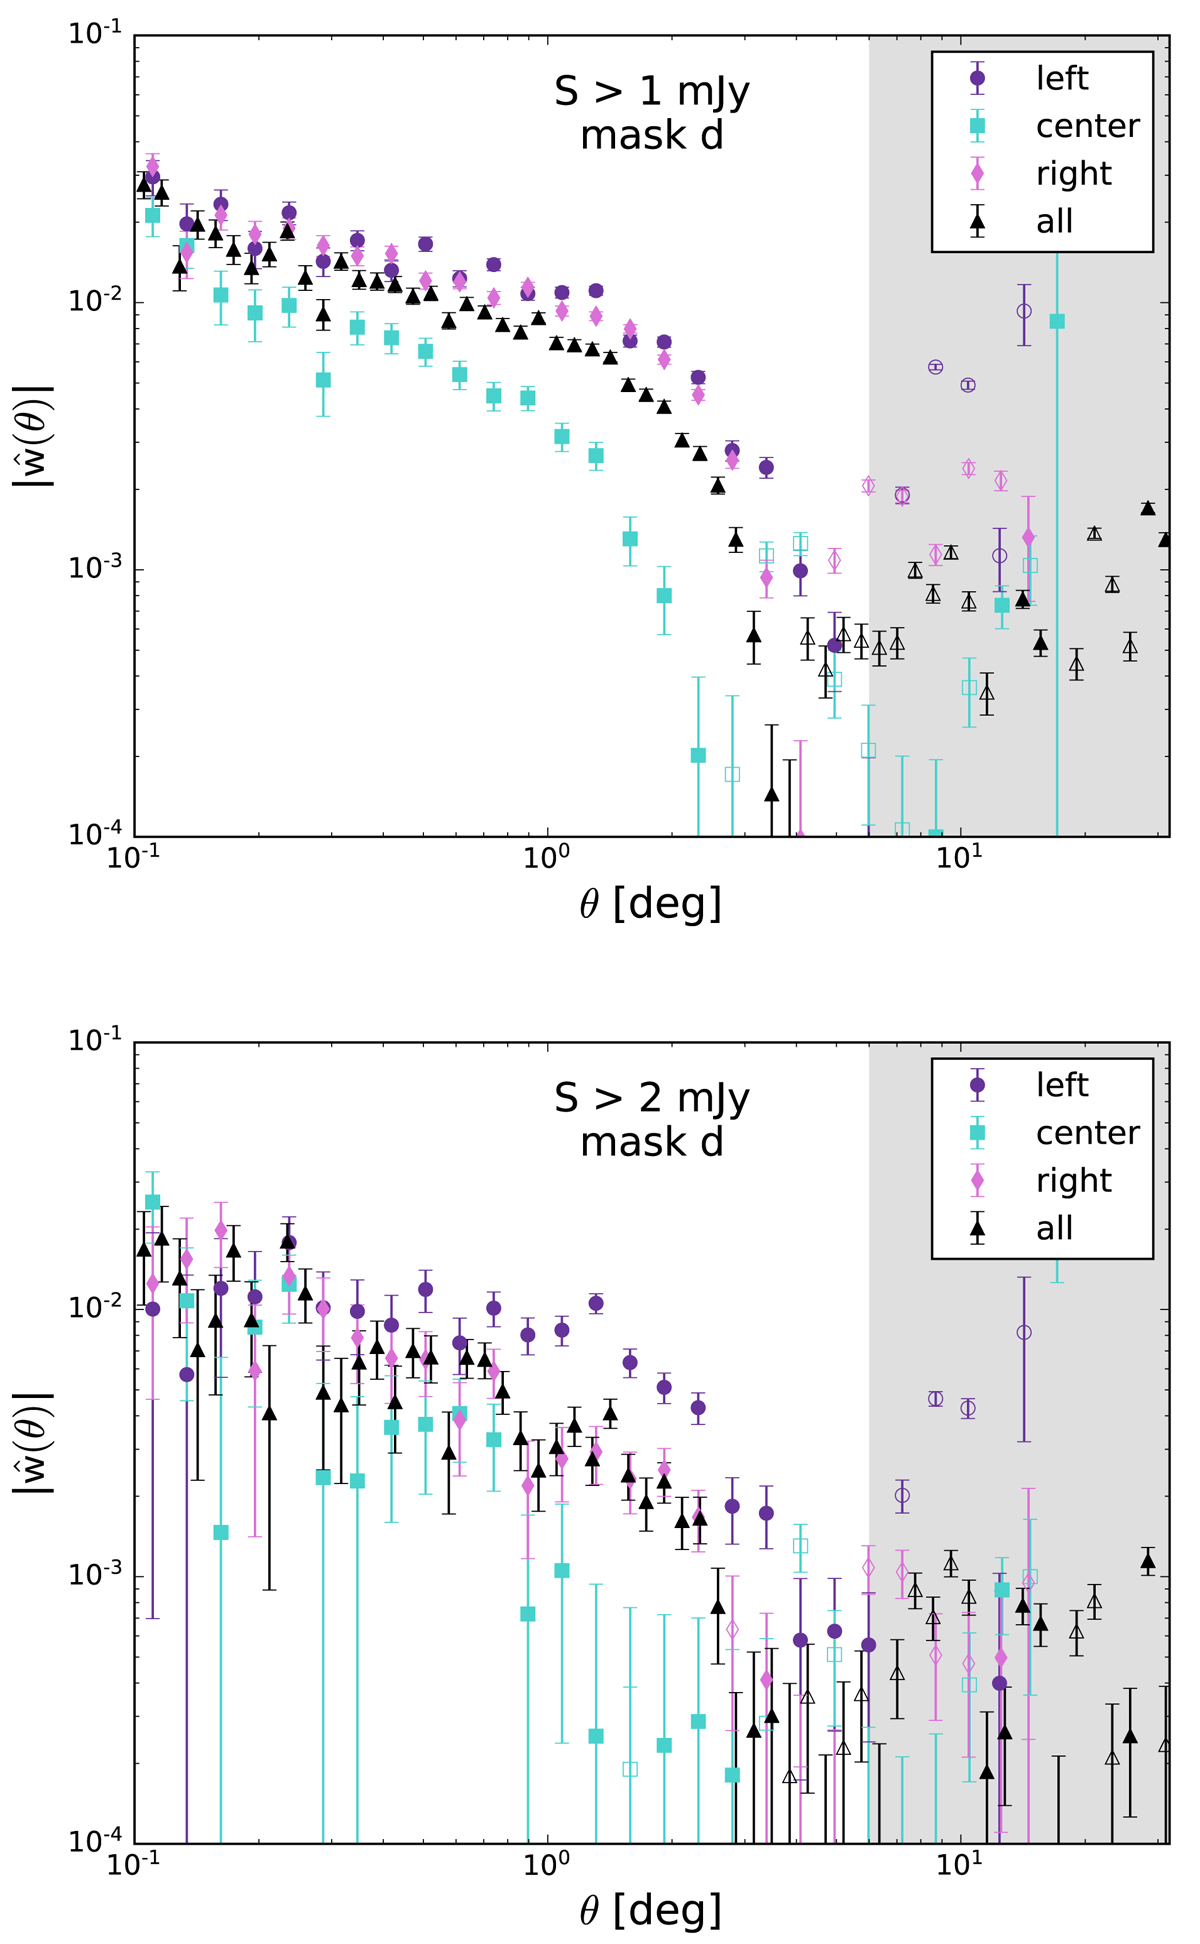
Angular two-point correlation function of sources from the LoTSS-DR1 value-added source catalogue with “mask d” and flux density threshold of 1 mJy and 2 mJy, for three regions namely “Left”, “Center”, and “Right”. ![]() for the non-partitioned region with 1 mJy and 2 mJy threshold and mask d is also plotted. Positive and negative values are shown with full and open symbols, respectively. The grey shaded region indicates angular separations with decreasing number of weighted pair counts.
for the non-partitioned region with 1 mJy and 2 mJy threshold and mask d is also plotted. Positive and negative values are shown with full and open symbols, respectively. The grey shaded region indicates angular separations with decreasing number of weighted pair counts.
Current usage metrics show cumulative count of Article Views (full-text article views including HTML views, PDF and ePub downloads, according to the available data) and Abstracts Views on Vision4Press platform.
Data correspond to usage on the plateform after 2015. The current usage metrics is available 48-96 hours after online publication and is updated daily on week days.
Initial download of the metrics may take a while.