Fig. 21.
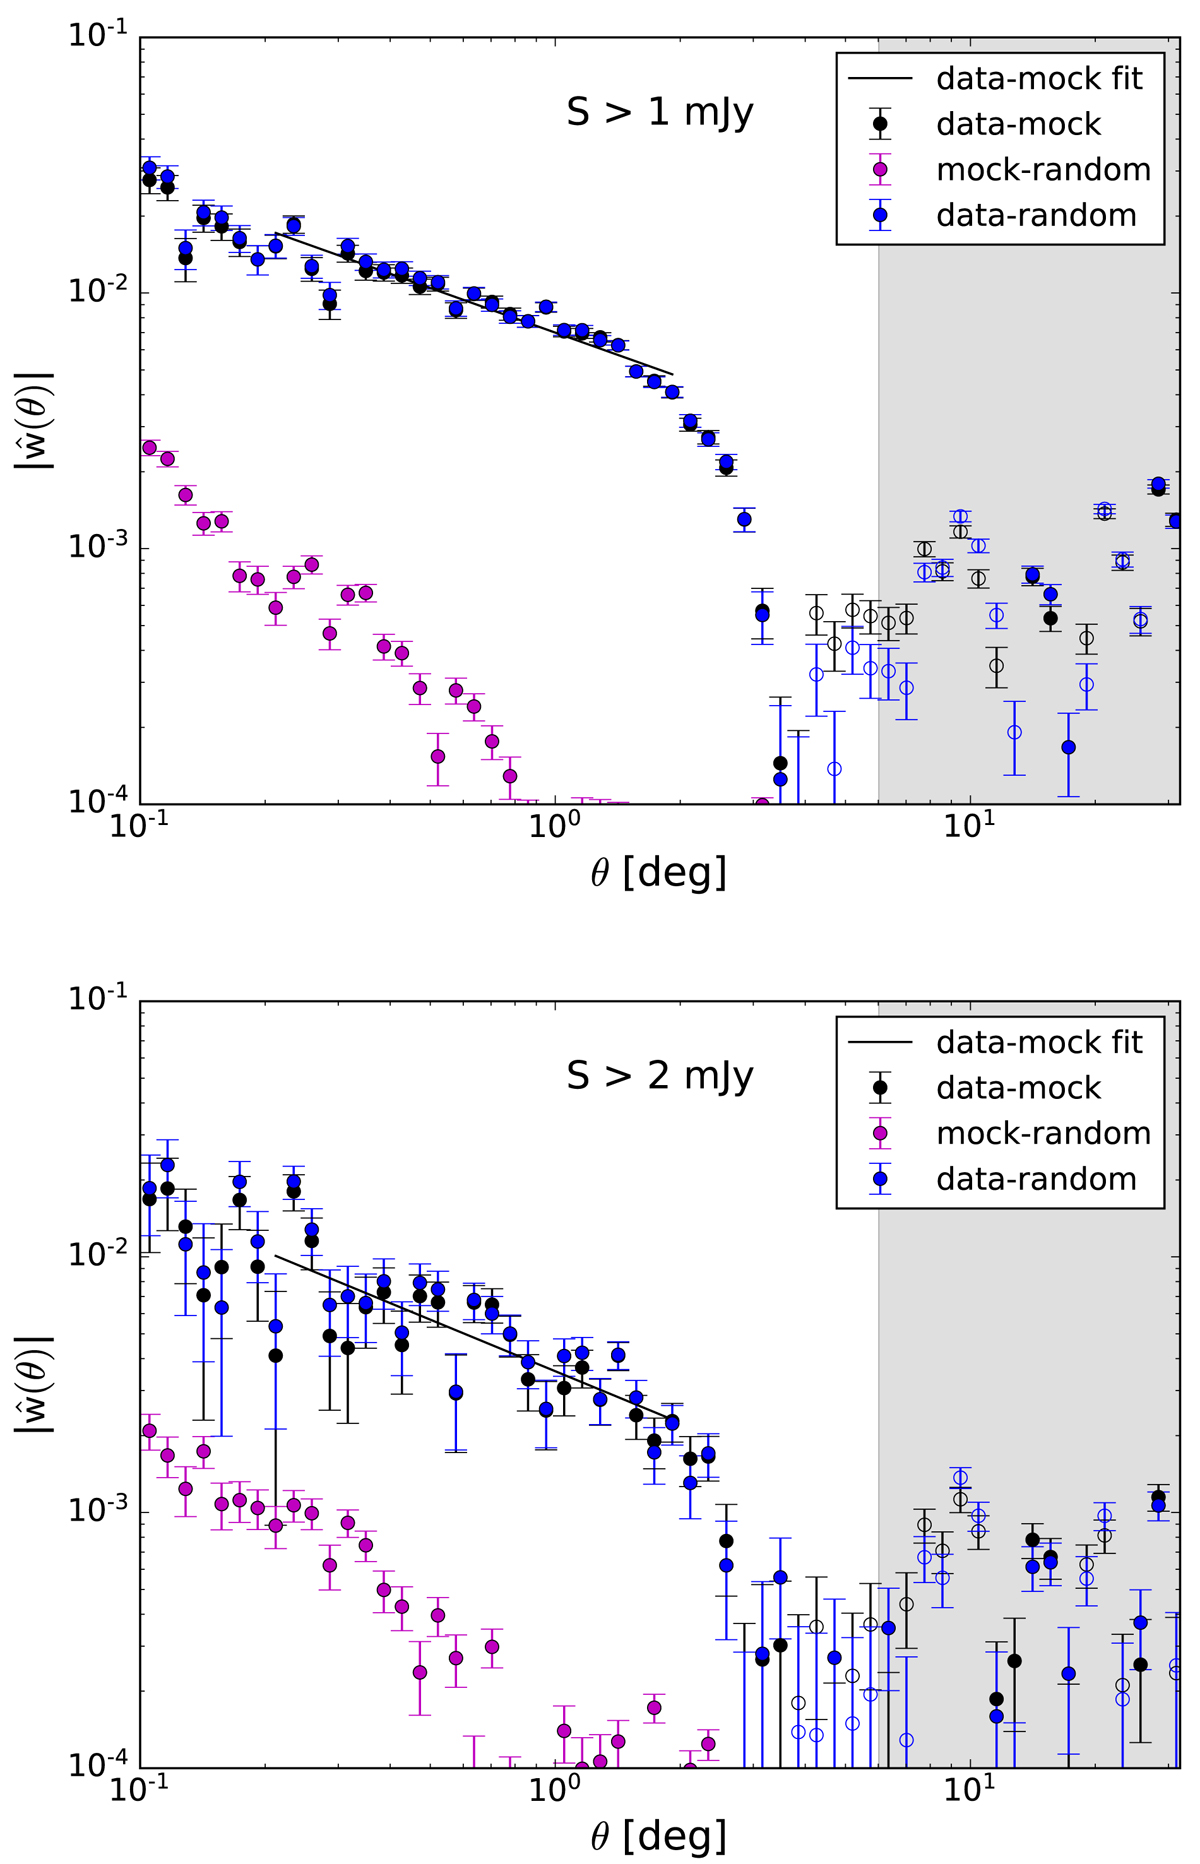
Comparison of two-point angular (auto-)correlation functions for “mask d” for different random catalogues: mock catalogue based on LoTSS local rms noise (data-mock), homogeneous random catalogue accounting for survey geometry only (data-random), and the correlation of the mock catalogue (mock-random) for flux densities above 1 mJy (top) and 2 mJy (bottom). We fitted the data to the power-law model described in the text. Positive and negative values are shown with full and open symbols, respectively. The grey shaded region indicates angular separations with decreasing number of weighted pair counts.
Current usage metrics show cumulative count of Article Views (full-text article views including HTML views, PDF and ePub downloads, according to the available data) and Abstracts Views on Vision4Press platform.
Data correspond to usage on the plateform after 2015. The current usage metrics is available 48-96 hours after online publication and is updated daily on week days.
Initial download of the metrics may take a while.