Fig. 15.
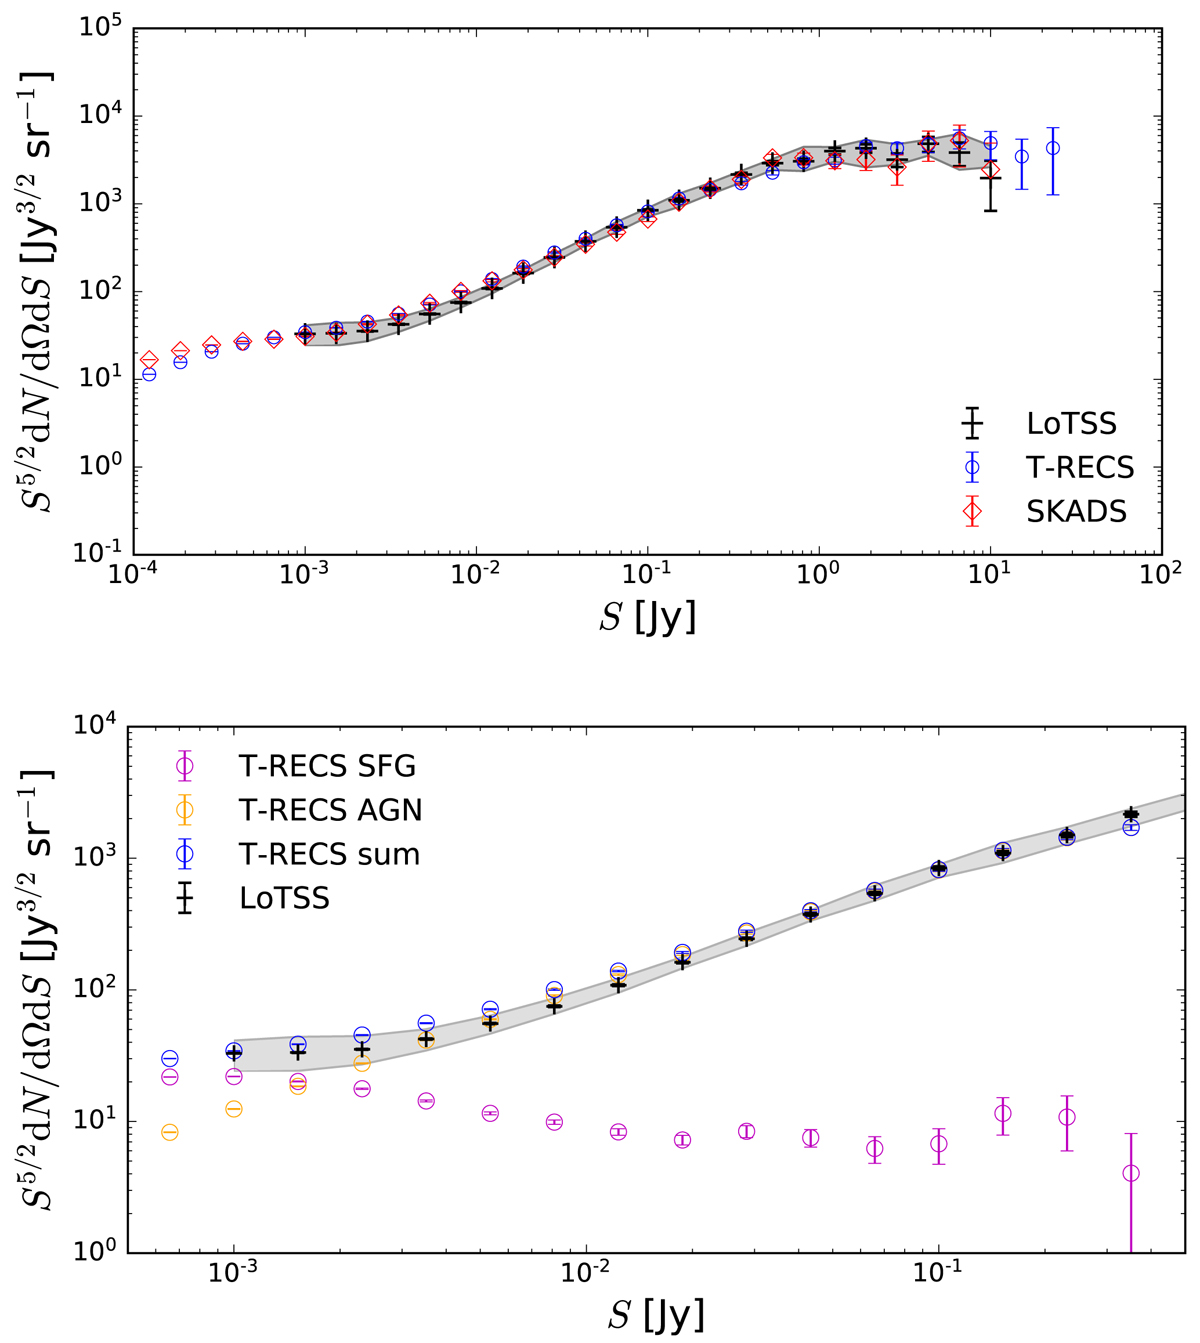
Top: comparison of LoTSS-DR1 differential source counts using “mask d” and SKADS 151 MHz and T-RECS “wide” 150 MHz simulations. The grey band corresponds to a ±20% variation of the LoTSS flux density scale due to uncertainties in the flux density calibration. Bottom: contributions from AGNs and SFGs in the T-RECS “wide” differential source counts as compared to the total LoTSS-DR1 differential source counts. All: error bars are due to Poisson noise in each flux density bin, which have equal bin width in log10(S).
Current usage metrics show cumulative count of Article Views (full-text article views including HTML views, PDF and ePub downloads, according to the available data) and Abstracts Views on Vision4Press platform.
Data correspond to usage on the plateform after 2015. The current usage metrics is available 48-96 hours after online publication and is updated daily on week days.
Initial download of the metrics may take a while.