Fig. 10.
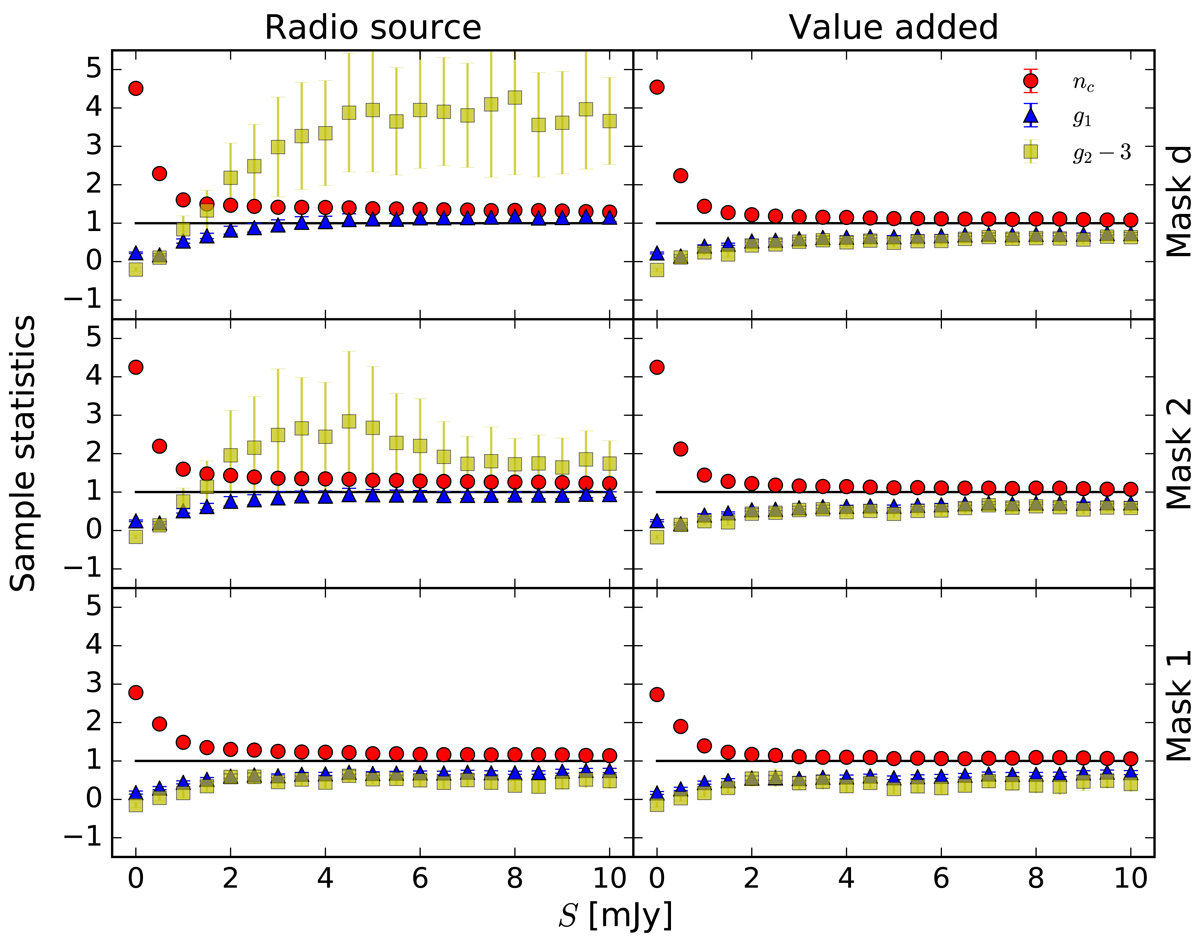
Sample statistics of number counts in cells as a function of flux density threshold. Shown are the clustering parameter nc (variance over mean), which is expected to be one for the Poisson distribution, the skewness g1 and excess kurtosis g2 − 3 with error bars calculated from 100 bootstrap samples. On the left hand side for the LoTSS-DR1 radio source catalogue, on the right hand side for the LoTSS-DR1 value-added source catalogue. From top to bottom: mask d and masks 2 and 1.
Current usage metrics show cumulative count of Article Views (full-text article views including HTML views, PDF and ePub downloads, according to the available data) and Abstracts Views on Vision4Press platform.
Data correspond to usage on the plateform after 2015. The current usage metrics is available 48-96 hours after online publication and is updated daily on week days.
Initial download of the metrics may take a while.