Fig. 18
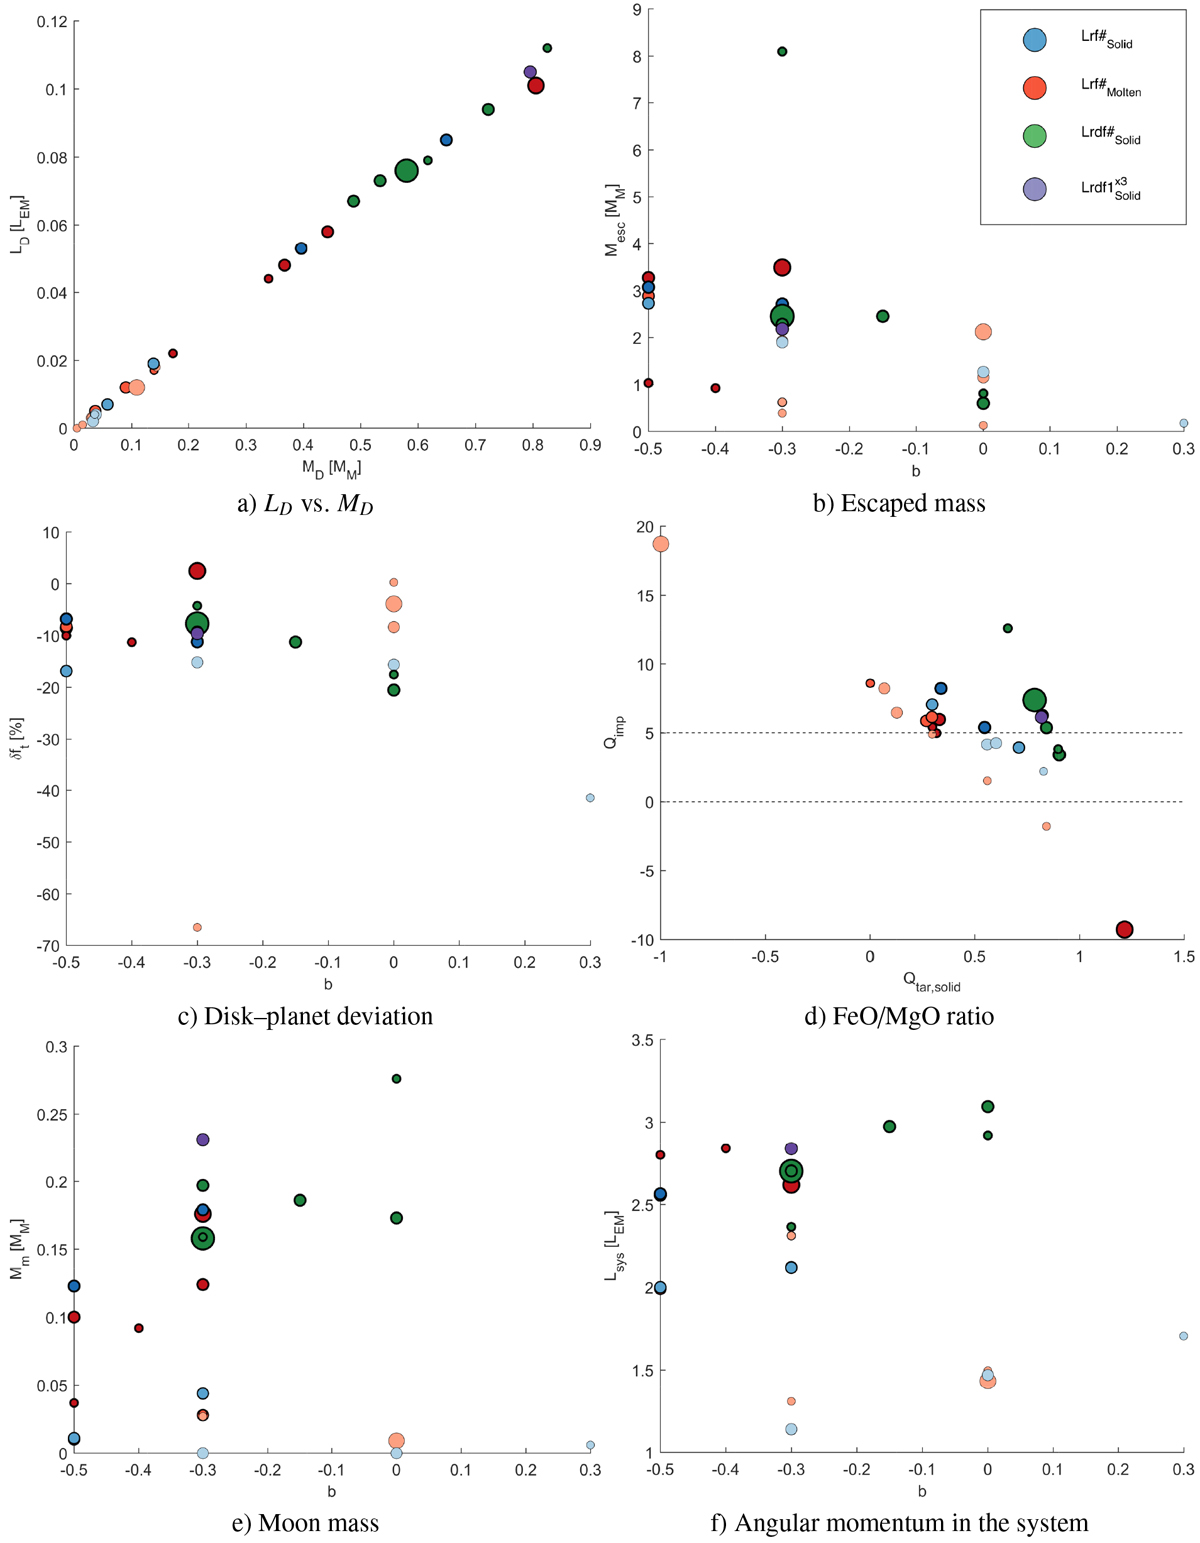
Results from all the simulations in Table 2. The size of the symbols represents the impact velocity. The thickness of the surrounding black line represents the different initial spin periods, with the thickest being the 2.3 h case. The colors represent different proto-Earth models: the blue, red, green, and purple represent the PES, PEM, two-layered model, and the two-layered model with three times the vaporization energy respectively. The gradient in the color represents the estimated mass of the Moon relative to the distribution. The dashed lines in panel d represent the limits of the allowed compositional value of the impactor. The dashed line in panel f represents the angular momentum of the 2.3 h spinning planet. Panel a: linear relationship between the mass and angular momentum of the disk. Panel c: reveals that, in general, there is a small disk–planet deviation. Panel d: shows that most of the simulations result in unrealistic Q values whichare outside the limits (0 < Qimp < 5). Panels e and f: show that we cannot create a Moon-like satellite in this case.
Current usage metrics show cumulative count of Article Views (full-text article views including HTML views, PDF and ePub downloads, according to the available data) and Abstracts Views on Vision4Press platform.
Data correspond to usage on the plateform after 2015. The current usage metrics is available 48-96 hours after online publication and is updated daily on week days.
Initial download of the metrics may take a while.