Fig. 11
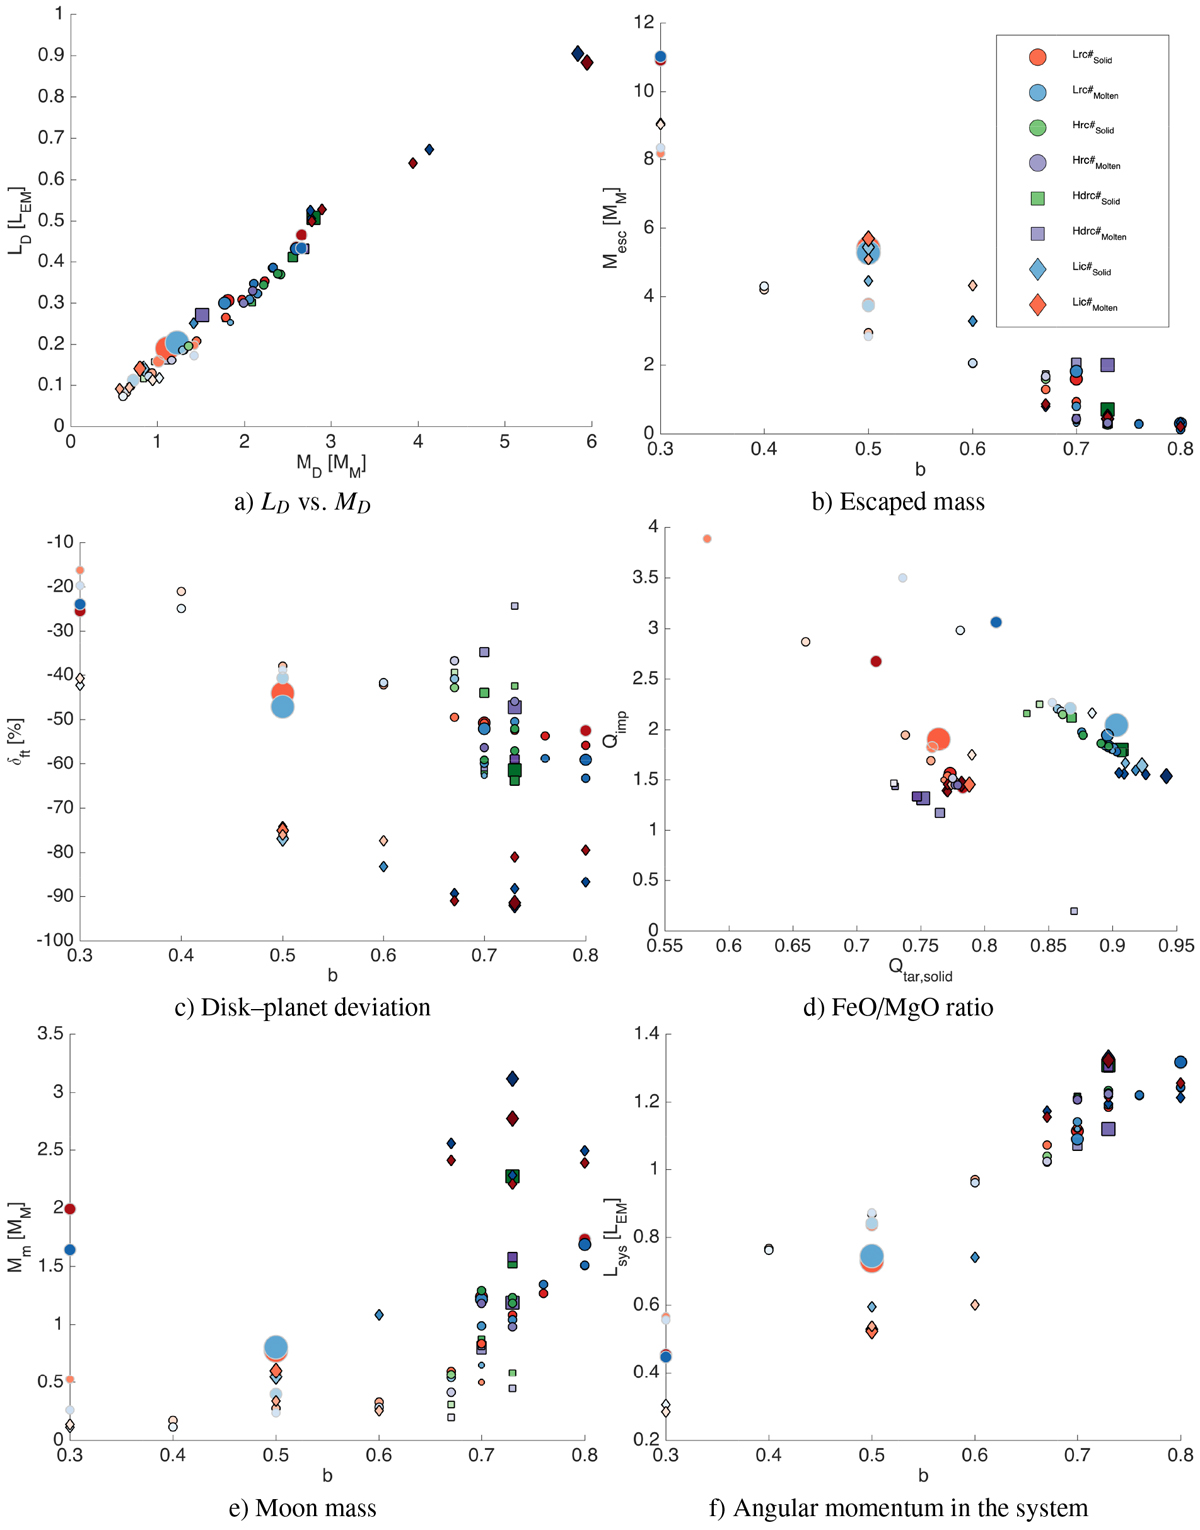
Simulation results (those from Table 1). The size of the symbols represents the angular momentum of the impact. The colors represent different resolutions and whether the PES or PEM model were used: the blue and redrepresent the low-resolution PES and PEM models, while the green and purple represent the high-resolution PES and PEM model. The gradient in color represents the estimated mass of the Moon relative to the distribution. Surrounding gray borders represent cases that have more than 10% iron in their disk. Circles represent collisions made with a multi-layered proto-Earth and a rocky impactor, diamonds represent collisions made with a multi-layered proto-Earth and an icy impactor, and squares represent collisions made with a simple-layered proto-Earth and a rocky impactor. Panel a: linear relationship between the mass and angular momentum of the disk. Panel b: increase in escaped mass as the impact parameter decreases, which is because of the higher impact velocity required to recreate the given Limp. From panel c we can see, in general, a high negative disk–planet deviation as we increase the impact parameter. Panel d: shows that Q values for all the simulations are within the realistic limits (0 < Qimp < 5). Panels e and f: show that most prominent impacts occur in the range of 0.7 < b < 0.76.
Current usage metrics show cumulative count of Article Views (full-text article views including HTML views, PDF and ePub downloads, according to the available data) and Abstracts Views on Vision4Press platform.
Data correspond to usage on the plateform after 2015. The current usage metrics is available 48-96 hours after online publication and is updated daily on week days.
Initial download of the metrics may take a while.