Fig. 1
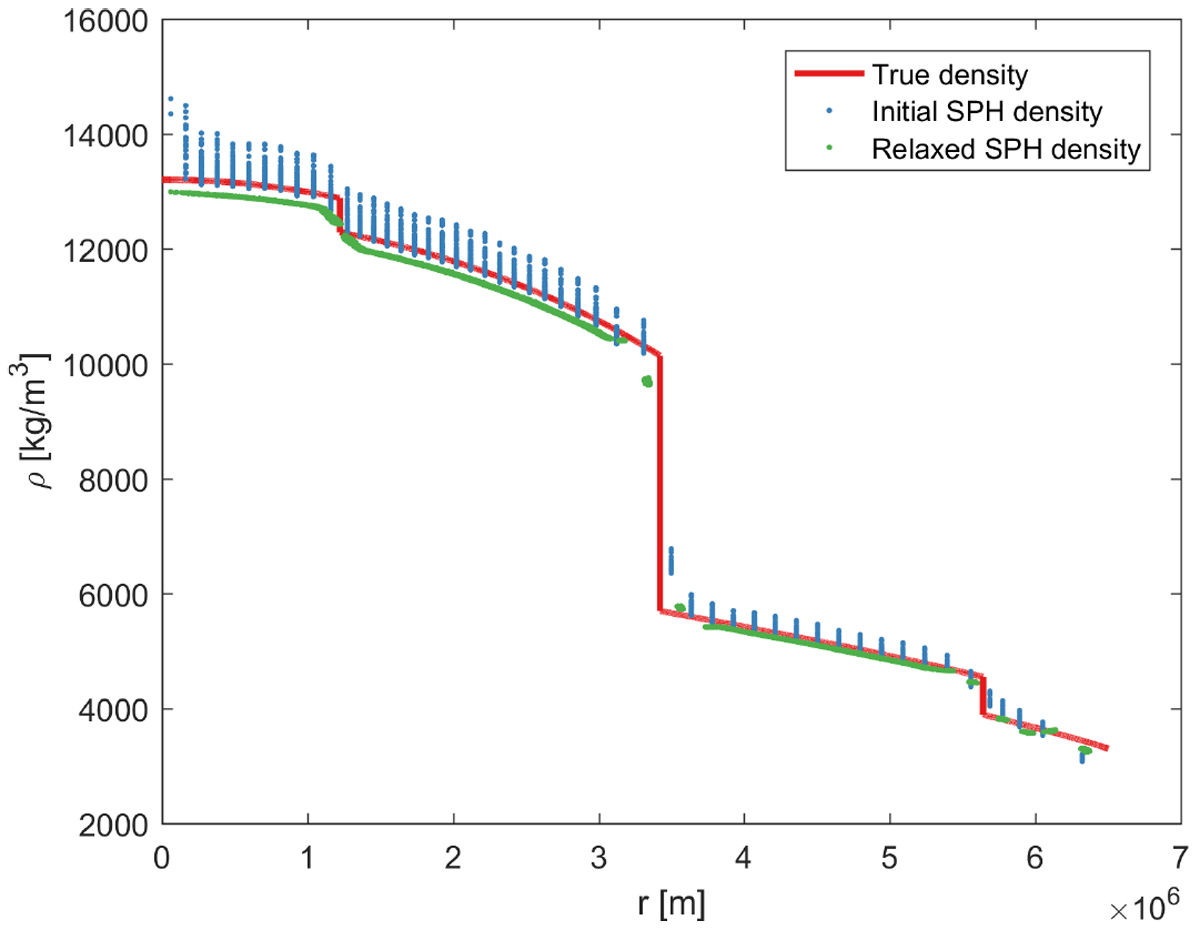
Depiction of the initial condition of the M = 1.05ME multi-layered PES model. Here, we show how the true density compares with the approximated density from the SPH summation formula. The initial SPH density is given from the initial distribution of particles using the method described in Appendix B. The density after relaxation is given by the green curve. We can see that in general we get a very good fit; however, we do get a slight a gap between the density discontinuities, which is characteristic of the artificial surface tension effect (Agertz et al. 2007).
Current usage metrics show cumulative count of Article Views (full-text article views including HTML views, PDF and ePub downloads, according to the available data) and Abstracts Views on Vision4Press platform.
Data correspond to usage on the plateform after 2015. The current usage metrics is available 48-96 hours after online publication and is updated daily on week days.
Initial download of the metrics may take a while.