Free Access
Fig. A.1.
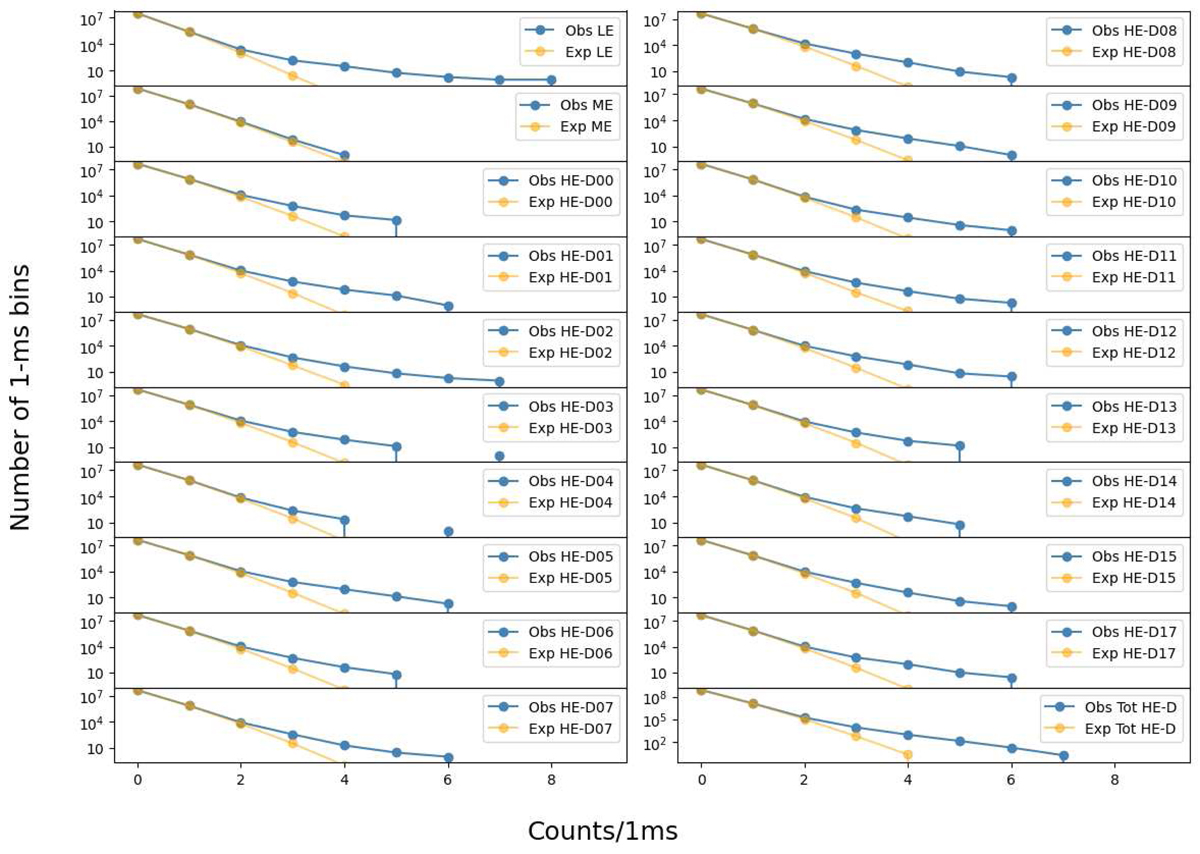
Total 1 ms count distribution for each of the 19 detectors (LE, ME, and 17 HE-NaI units): blue solid lines show the observed distribution, while the orange ones show the same distributions expected from a varying background model purely affected by Poisson noise. Bottom right panel: summed distribution of the HE units.
Current usage metrics show cumulative count of Article Views (full-text article views including HTML views, PDF and ePub downloads, according to the available data) and Abstracts Views on Vision4Press platform.
Data correspond to usage on the plateform after 2015. The current usage metrics is available 48-96 hours after online publication and is updated daily on week days.
Initial download of the metrics may take a while.