Fig. 3
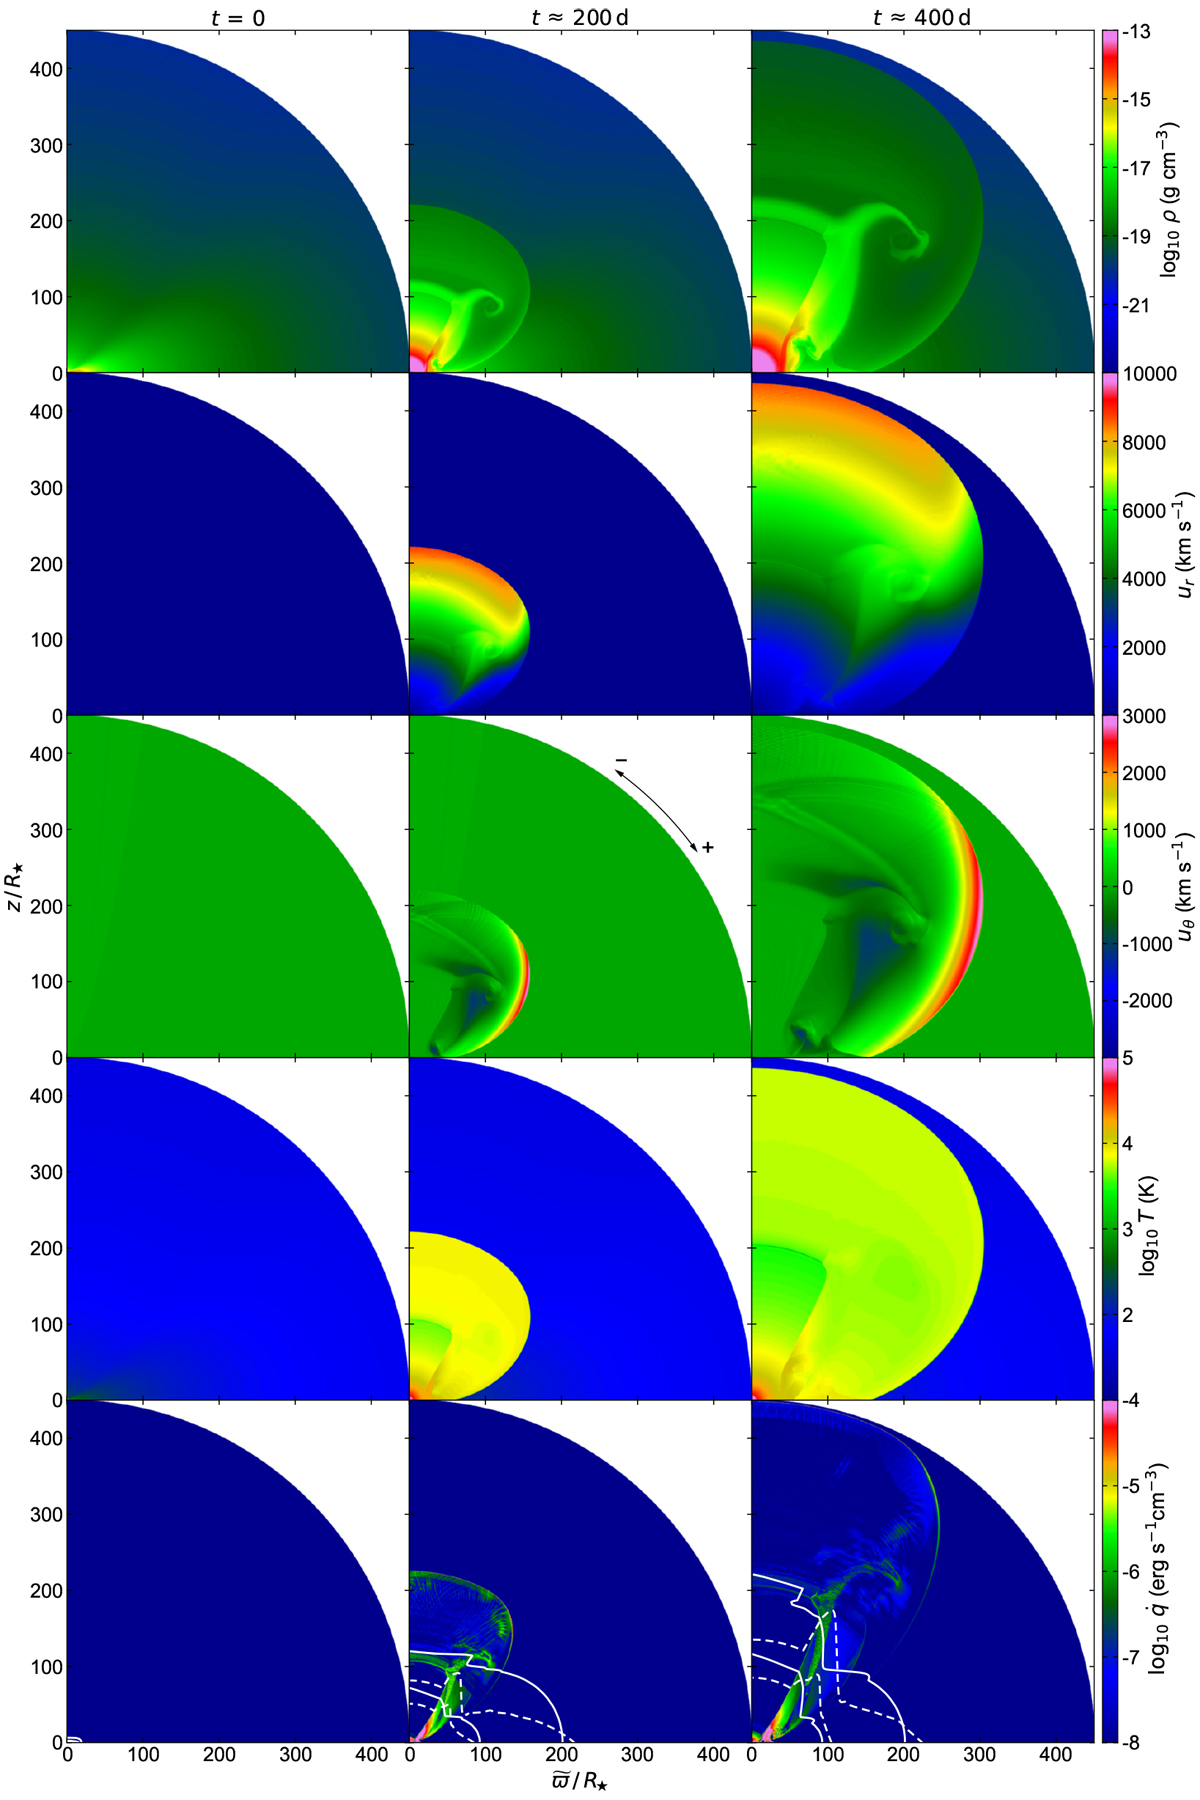
Stages in the evolution of SN ejecta interacting with circumstellar disk (model A). The columns show snapshots at times t = 0, 200, and 400 days. Each row shows different quantity, from top to bottom: density ρ, radial velocity ur, polar velocity uθ, temperature T, and shock heating rate ![]() .
Bottom row: includes two contours of constant optical depth to electron scattering for two sight lines:
θ = 0 (looking from the top, dashed white lines) and θ = π∕2 (looking from the right of the plot, solid white lines). Inner and outer lines correspond to optical depths of
2∕3 and 0.1, respectively. The + and − signs in the middle panel of the middle row illustrate the sign convention for polar velocity
uθ. To conserve the size of the files, the resolution of the bitmaps was reduced down from the resolution of our simulations. Animated version of this figure is available as the movie A.
.
Bottom row: includes two contours of constant optical depth to electron scattering for two sight lines:
θ = 0 (looking from the top, dashed white lines) and θ = π∕2 (looking from the right of the plot, solid white lines). Inner and outer lines correspond to optical depths of
2∕3 and 0.1, respectively. The + and − signs in the middle panel of the middle row illustrate the sign convention for polar velocity
uθ. To conserve the size of the files, the resolution of the bitmaps was reduced down from the resolution of our simulations. Animated version of this figure is available as the movie A.
Current usage metrics show cumulative count of Article Views (full-text article views including HTML views, PDF and ePub downloads, according to the available data) and Abstracts Views on Vision4Press platform.
Data correspond to usage on the plateform after 2015. The current usage metrics is available 48-96 hours after online publication and is updated daily on week days.
Initial download of the metrics may take a while.