Fig. 2
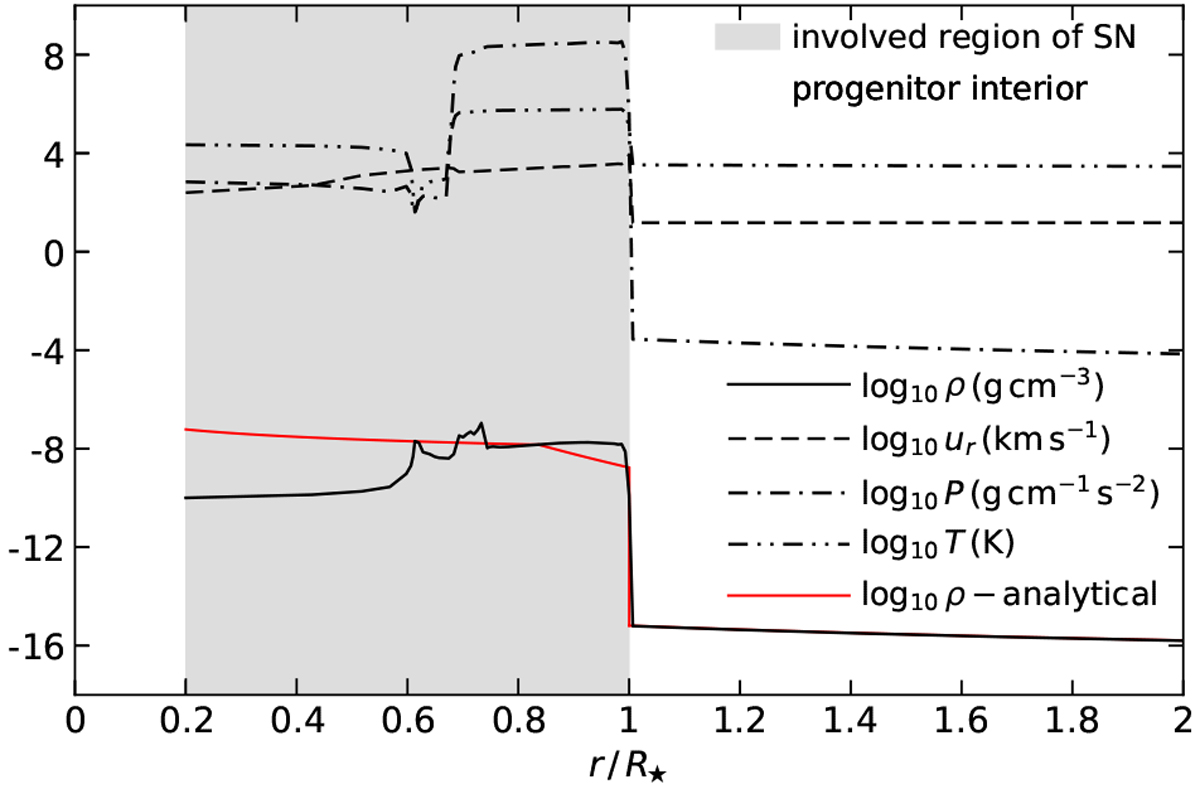
Initial profiles of selected hydrodynamic quantities. Black lines show the initial numerical profiles of density ρ, radial velocity ur, pressure P, and temperature T of the SN ejecta (gray region with 0.2 ≤ r∕R⋆ ≤ 1) and of the stellar wind in the close vicinity (r > R⋆). The red lineshows the initial analytical density profile described in Appendix A.
Current usage metrics show cumulative count of Article Views (full-text article views including HTML views, PDF and ePub downloads, according to the available data) and Abstracts Views on Vision4Press platform.
Data correspond to usage on the plateform after 2015. The current usage metrics is available 48-96 hours after online publication and is updated daily on week days.
Initial download of the metrics may take a while.