Fig. 12
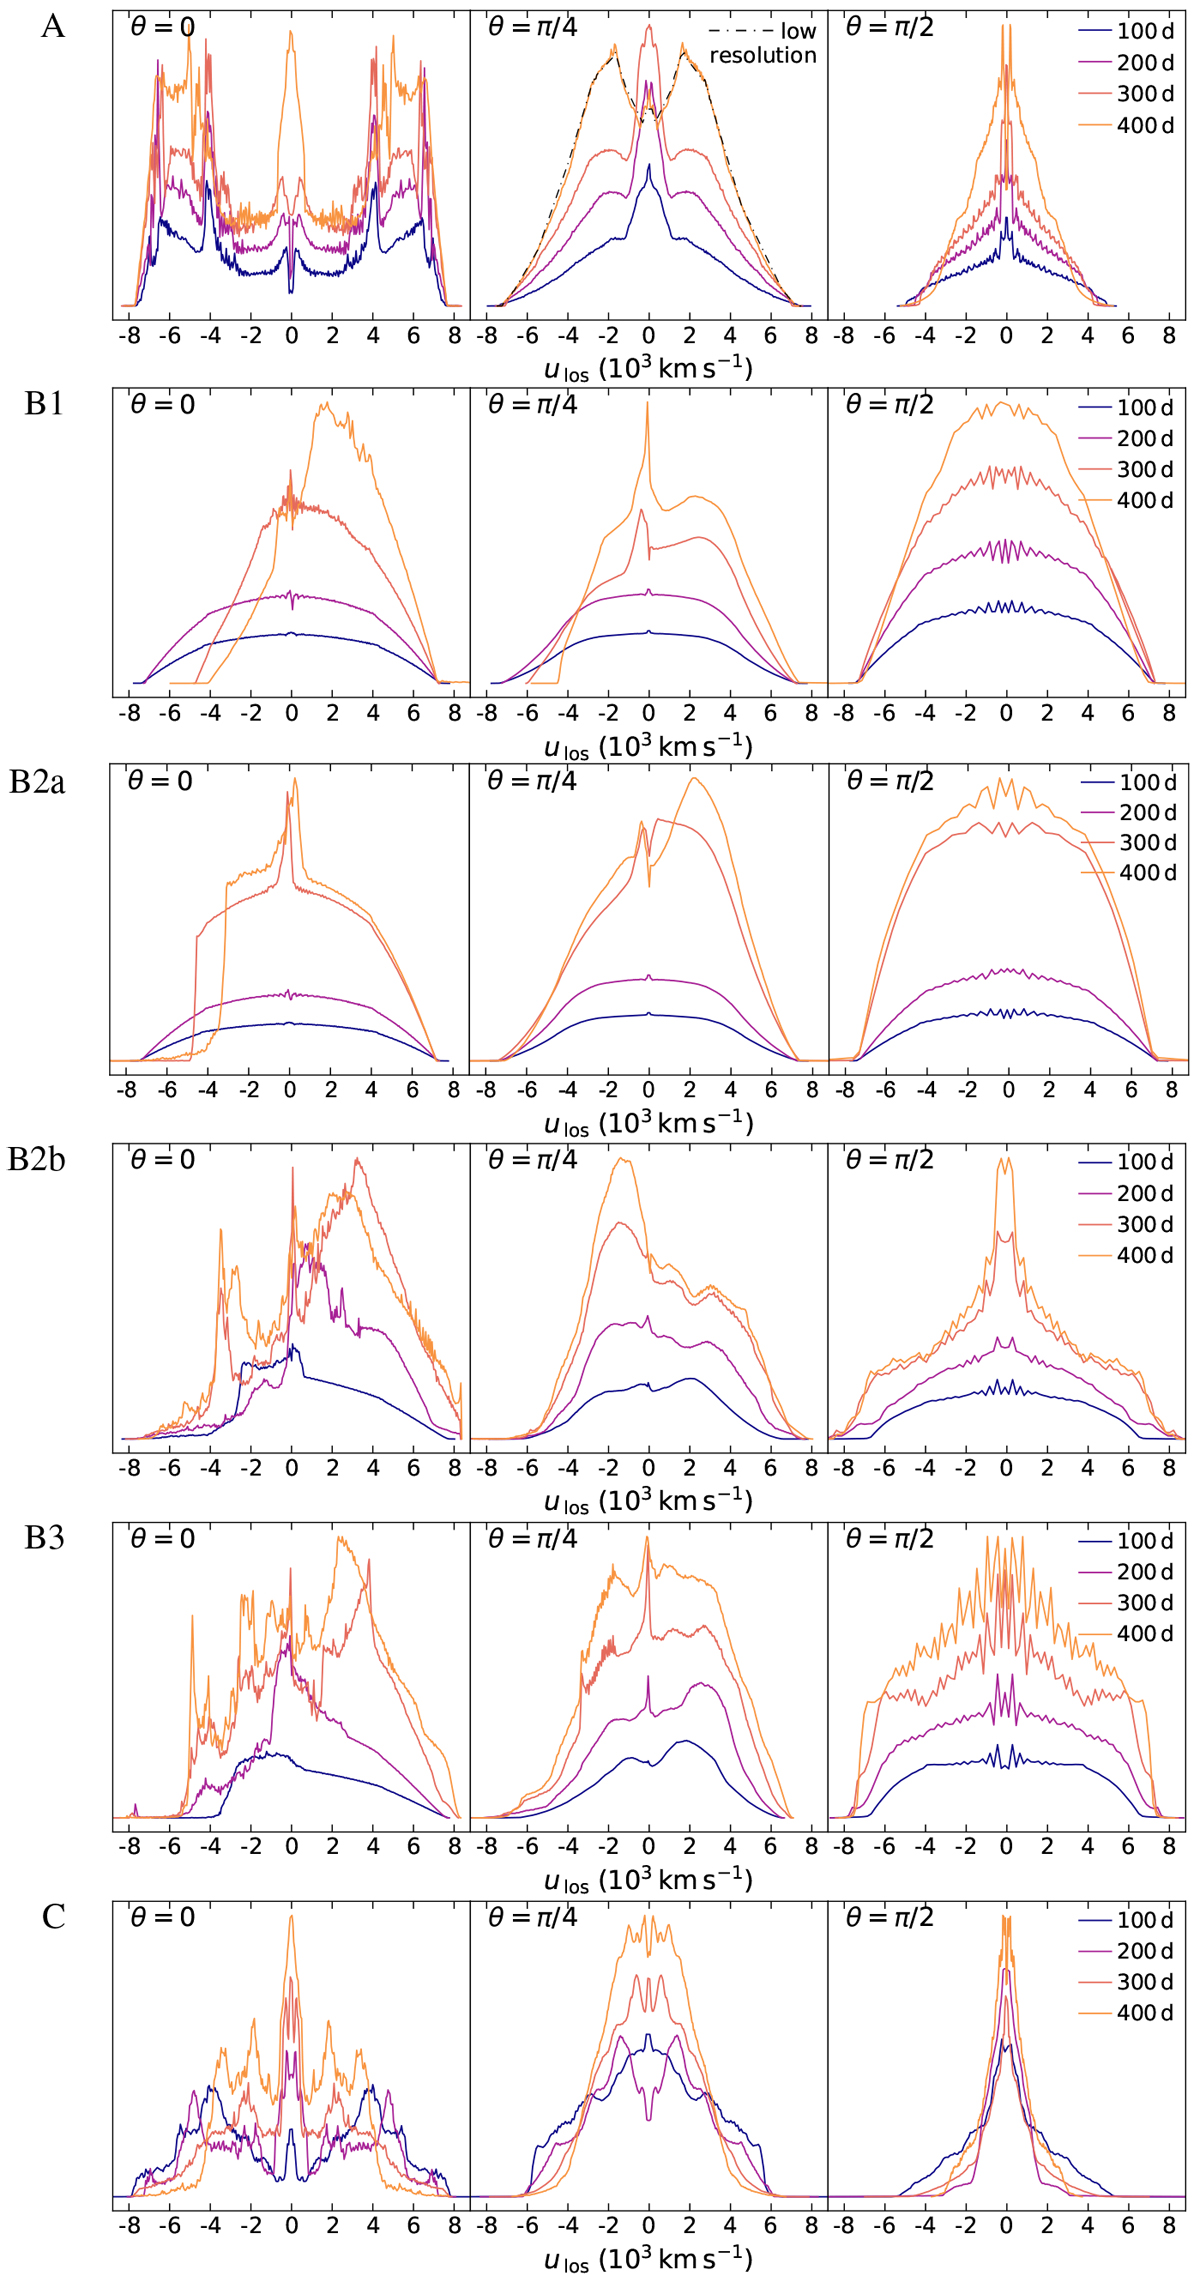
Line-of-sight velocity distributions for our models. Each row corresponds to a different model, labeled on the left, and each column represents different viewing angle θ. Colored lines are results for different simulation times with legend given in the plot. The distributions are normalized to ensure clarity of the presentation and hence we do not display units on the vertical axes. The distributions are plotted on a linear scale. Some of the features around |uLOS | ≈ 0 are an artifact of subtraction of CSM that has not collided with the SN ejecta. The black dash-dotted line in the middle panel of model A illustrates the 400 d lower resolution model.
Current usage metrics show cumulative count of Article Views (full-text article views including HTML views, PDF and ePub downloads, according to the available data) and Abstracts Views on Vision4Press platform.
Data correspond to usage on the plateform after 2015. The current usage metrics is available 48-96 hours after online publication and is updated daily on week days.
Initial download of the metrics may take a while.