Fig. 10
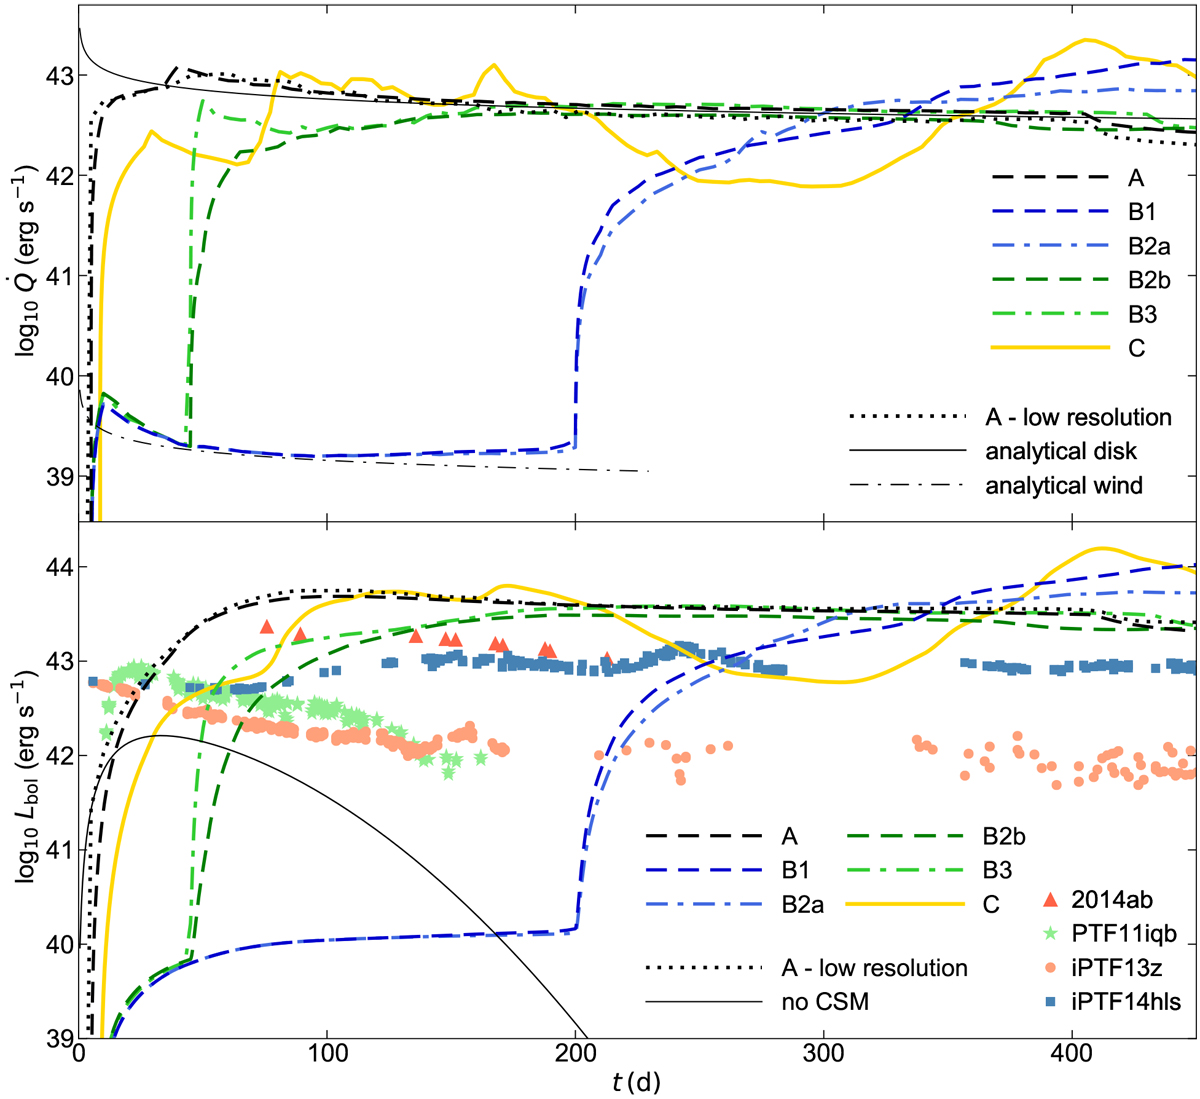
Estimates of light curves from our simulations. Top: shock heating rate
![]() for our models (thick black dashed line for model A and thick colored lines for other models). The thinblack dash-dotted line shows the analytic solution for shock passing through the wind with the same parameters as in Sect. 2.2.2. The thin black solid line shows the analytic solution for interaction with a circumstellar disk (Eq. (A.10), slope parameter
n = 12, disk openingangle
for our models (thick black dashed line for model A and thick colored lines for other models). The thinblack dash-dotted line shows the analytic solution for shock passing through the wind with the same parameters as in Sect. 2.2.2. The thin black solid line shows the analytic solution for interaction with a circumstellar disk (Eq. (A.10), slope parameter
n = 12, disk openingangle ![]() ). The black dotted line demonstrates the
). The black dotted line demonstrates the ![]() for model A calculated with lower resolution. Bottom: bolometric light curves from Eqs. (10) and (11). The thick black and colored lines are estimated light curves for our models. The black dotted line shows the light curve for model A calculated with lower resolution. The thin black solid line labeled “no CSM” corresponds to a hypothetical SN without CSM interaction but heated with
0.28 M⊙
of radioactive nickel. This choice roughly corresponds to the brightest normal hydrogen-rich SNe (Pejcha & Prieto 2015; Müller et al. 2017) or the population mean of stripped-envelope SNe (Anderson 2019). The calculated bolometric light curves are compared with the observed light curves of SN2014ab (Bilinski et al. 2020), PTF11iqb (Smith et al. 2015), iPTF13z (Nyholm et al. 2017), and iPTF14hls (Arcavi et al. 2017) shown with points.
for model A calculated with lower resolution. Bottom: bolometric light curves from Eqs. (10) and (11). The thick black and colored lines are estimated light curves for our models. The black dotted line shows the light curve for model A calculated with lower resolution. The thin black solid line labeled “no CSM” corresponds to a hypothetical SN without CSM interaction but heated with
0.28 M⊙
of radioactive nickel. This choice roughly corresponds to the brightest normal hydrogen-rich SNe (Pejcha & Prieto 2015; Müller et al. 2017) or the population mean of stripped-envelope SNe (Anderson 2019). The calculated bolometric light curves are compared with the observed light curves of SN2014ab (Bilinski et al. 2020), PTF11iqb (Smith et al. 2015), iPTF13z (Nyholm et al. 2017), and iPTF14hls (Arcavi et al. 2017) shown with points.
Current usage metrics show cumulative count of Article Views (full-text article views including HTML views, PDF and ePub downloads, according to the available data) and Abstracts Views on Vision4Press platform.
Data correspond to usage on the plateform after 2015. The current usage metrics is available 48-96 hours after online publication and is updated daily on week days.
Initial download of the metrics may take a while.