Fig. 4
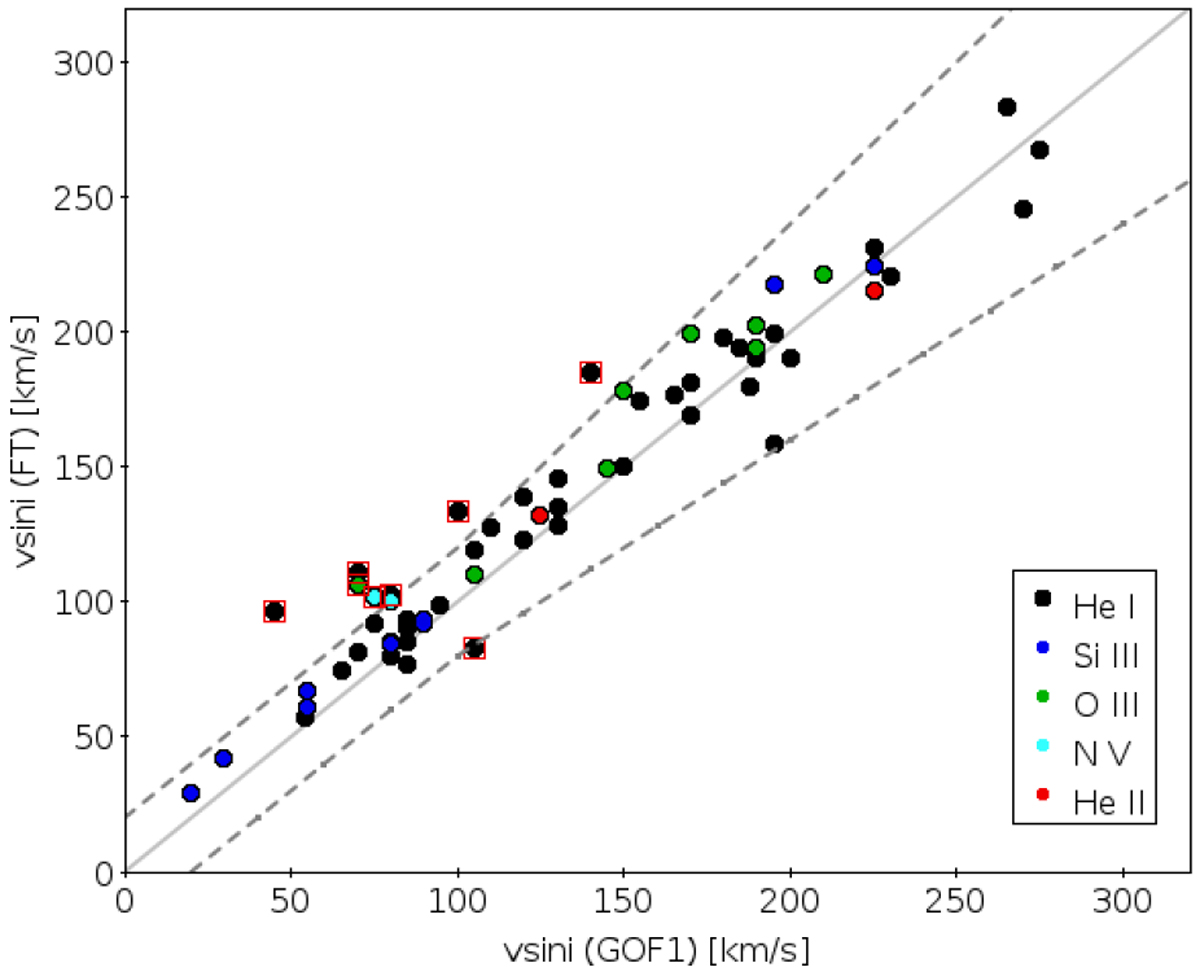
Comparison of projected rotational velocities resulting from the Fourier Transform (FT) and the Goodness-Of-Fit (GOF1) techniques obtained using the iacob-broad tool. Dashed lines represent a difference of 20 km s−1 or 20% from the 1:1 relation, whichever is the largest. Red squares indicate those stars out of these limits. Different colors indicate the diagnostic lines used for the line-broadening characterization.
Current usage metrics show cumulative count of Article Views (full-text article views including HTML views, PDF and ePub downloads, according to the available data) and Abstracts Views on Vision4Press platform.
Data correspond to usage on the plateform after 2015. The current usage metrics is available 48-96 hours after online publication and is updated daily on week days.
Initial download of the metrics may take a while.