Fig. 9.
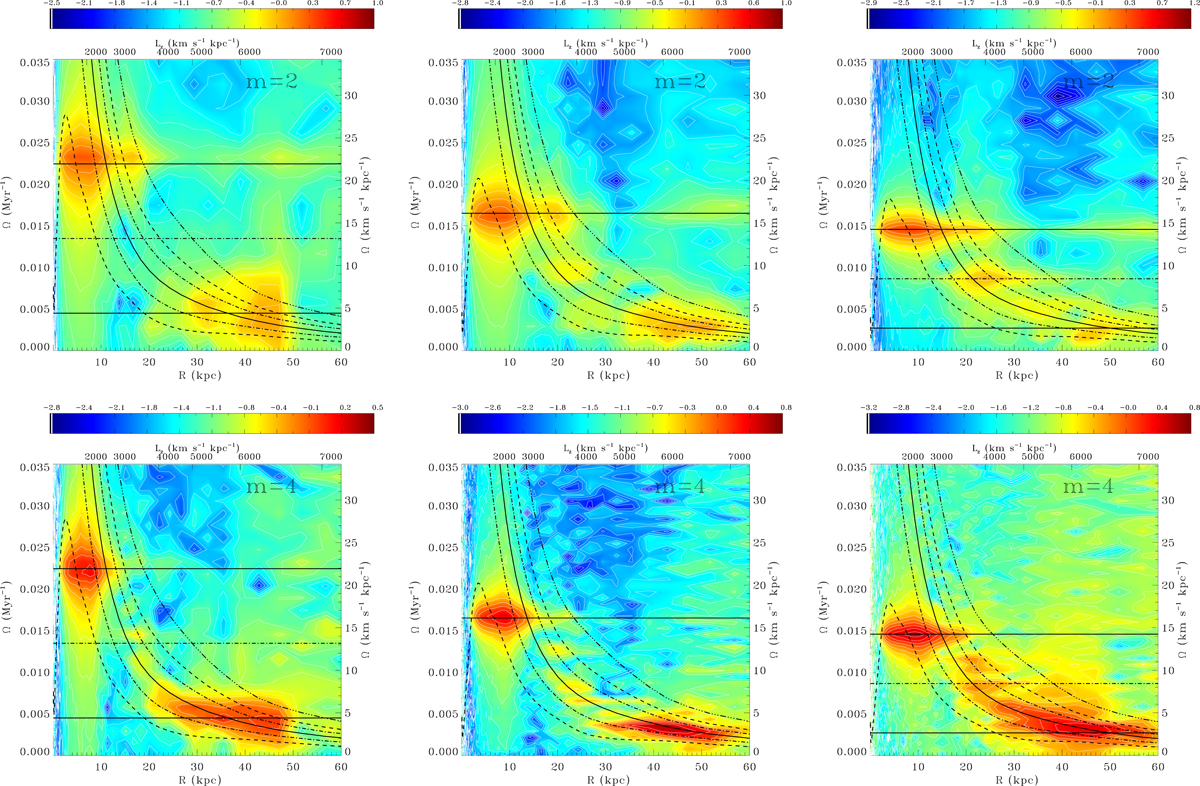
Top row: m = 2 power spectra in log scale as a function of radius for RunC. The time windows are 3.16−4.24 Gyr (left panel), 6.32−8.48 Gyr (middle), and 8.38−10.54 Gyr (right). The vertical scales give values of Ω in Myr−1 (left) and in km s−1 kpc−1 (right). The radial scale (in kpc) is converted in Lz using the circular rotation curve. The mean curves Ω ± κ/2 are drawn as black short-dashed lines, Ω ± κ/4 as dot-dashed lines, Ω as a solid line (for the CR), and Ω + κ as a triple-dot-dashed line. The uppermost full horizontal line represents the mean bar pattern speed ΩB = 21.9−14.2 (full line), which was determined directly from the time variation of the bar position-angle. The lowest one is an estimated intermittent waves packet ΩoW ≈ 4.4−2.6 km s−1 kpc−1. The intermediate wave at ΩiS ≈ 13.2−8.4 km s−1 kpc−1 is computed as a beat mode. Bottom row: same, but for m = 4.
Current usage metrics show cumulative count of Article Views (full-text article views including HTML views, PDF and ePub downloads, according to the available data) and Abstracts Views on Vision4Press platform.
Data correspond to usage on the plateform after 2015. The current usage metrics is available 48-96 hours after online publication and is updated daily on week days.
Initial download of the metrics may take a while.