Fig. 8.
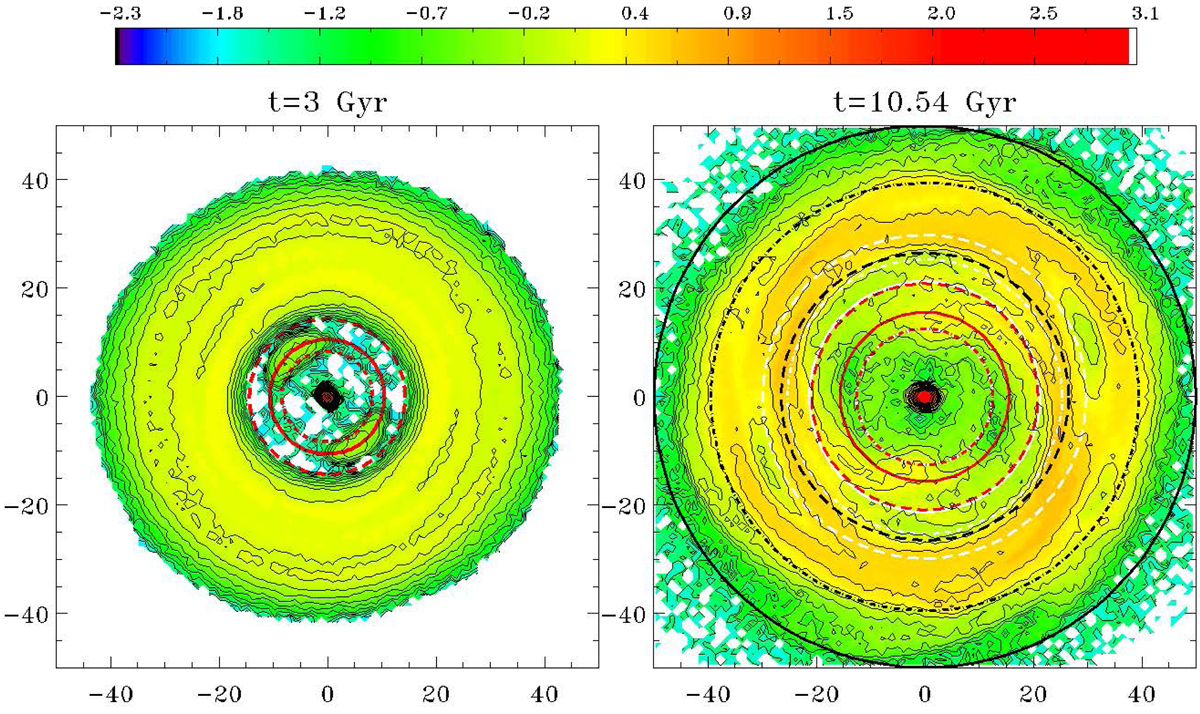
Projected mass surface density for particles selected as ![]() kpc km s−1 at t = 3 Gyr (left panel) inside ±50 kpc. Their distribution at t = 10.54 Gyr (right panel). The log colourscale is common to both figures (in M⊙ pc−2). Black isodensities are spaced by 0.2 dex. Circles show the position for the ILR (dot-dashed line), the UHR and outer m = + 4 resonance (short-dashed), the CR (full line), and the OLR (long-dashed). In red, the following resonances for the stellar bar are shown: UHRB, CRB, and OLRB, as defined in Sect. 6. Using the same linestyle, the white circles represent the intermediate spiral: ILRiS (close to UHRB), CRiS (close to OLRB), outer m = +4 resonance, and OLRiS. The black circles represent the outer wave ILRoW (close to intermediate spiral outer m = +4 resonance), UHRoW, and CRoW.
kpc km s−1 at t = 3 Gyr (left panel) inside ±50 kpc. Their distribution at t = 10.54 Gyr (right panel). The log colourscale is common to both figures (in M⊙ pc−2). Black isodensities are spaced by 0.2 dex. Circles show the position for the ILR (dot-dashed line), the UHR and outer m = + 4 resonance (short-dashed), the CR (full line), and the OLR (long-dashed). In red, the following resonances for the stellar bar are shown: UHRB, CRB, and OLRB, as defined in Sect. 6. Using the same linestyle, the white circles represent the intermediate spiral: ILRiS (close to UHRB), CRiS (close to OLRB), outer m = +4 resonance, and OLRiS. The black circles represent the outer wave ILRoW (close to intermediate spiral outer m = +4 resonance), UHRoW, and CRoW.
Current usage metrics show cumulative count of Article Views (full-text article views including HTML views, PDF and ePub downloads, according to the available data) and Abstracts Views on Vision4Press platform.
Data correspond to usage on the plateform after 2015. The current usage metrics is available 48-96 hours after online publication and is updated daily on week days.
Initial download of the metrics may take a while.