Open Access
Fig. 4.
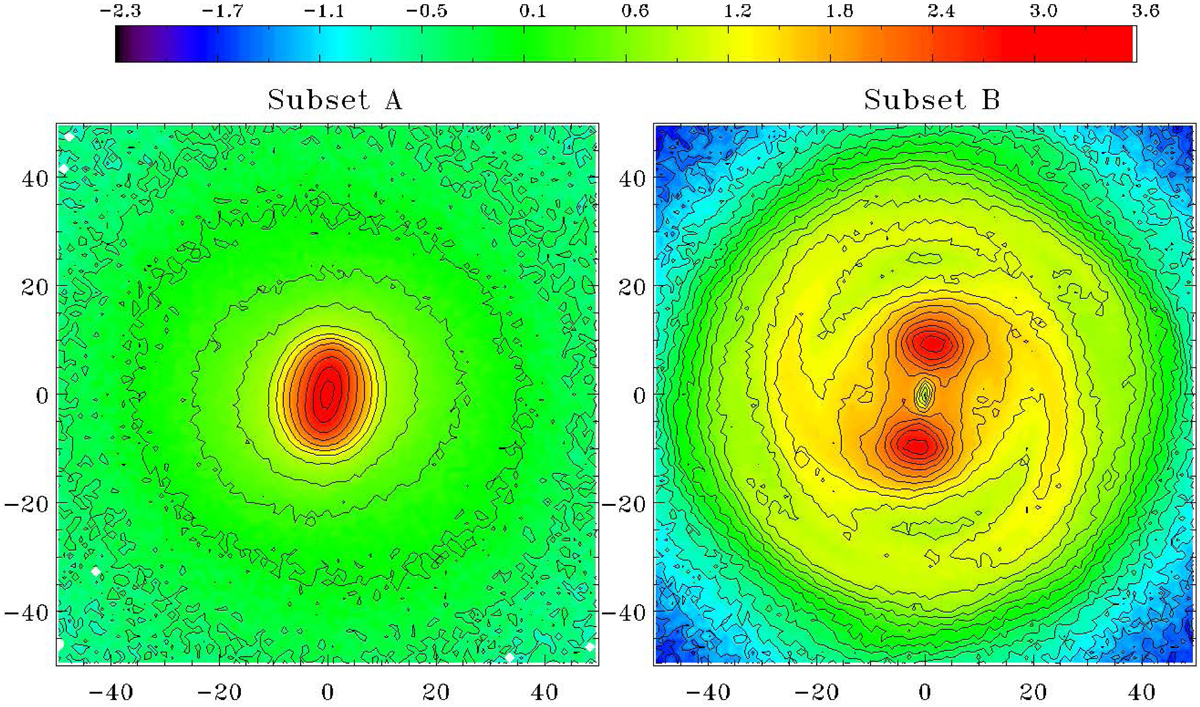
Projected mass surface density (in M⊙ pc−2) at t = 10.54 Gyr inside ±50 kpc. Particle sets are defined in Fig. 3 and in the main text. The log colourscale is common to both figures. Black isodensities are spaced by 0.4 dex for Subset A (left panel) and 0.1 for Subset B (right panel). The spatial scale is in kpc.
Current usage metrics show cumulative count of Article Views (full-text article views including HTML views, PDF and ePub downloads, according to the available data) and Abstracts Views on Vision4Press platform.
Data correspond to usage on the plateform after 2015. The current usage metrics is available 48-96 hours after online publication and is updated daily on week days.
Initial download of the metrics may take a while.