Open Access
Fig. 1.
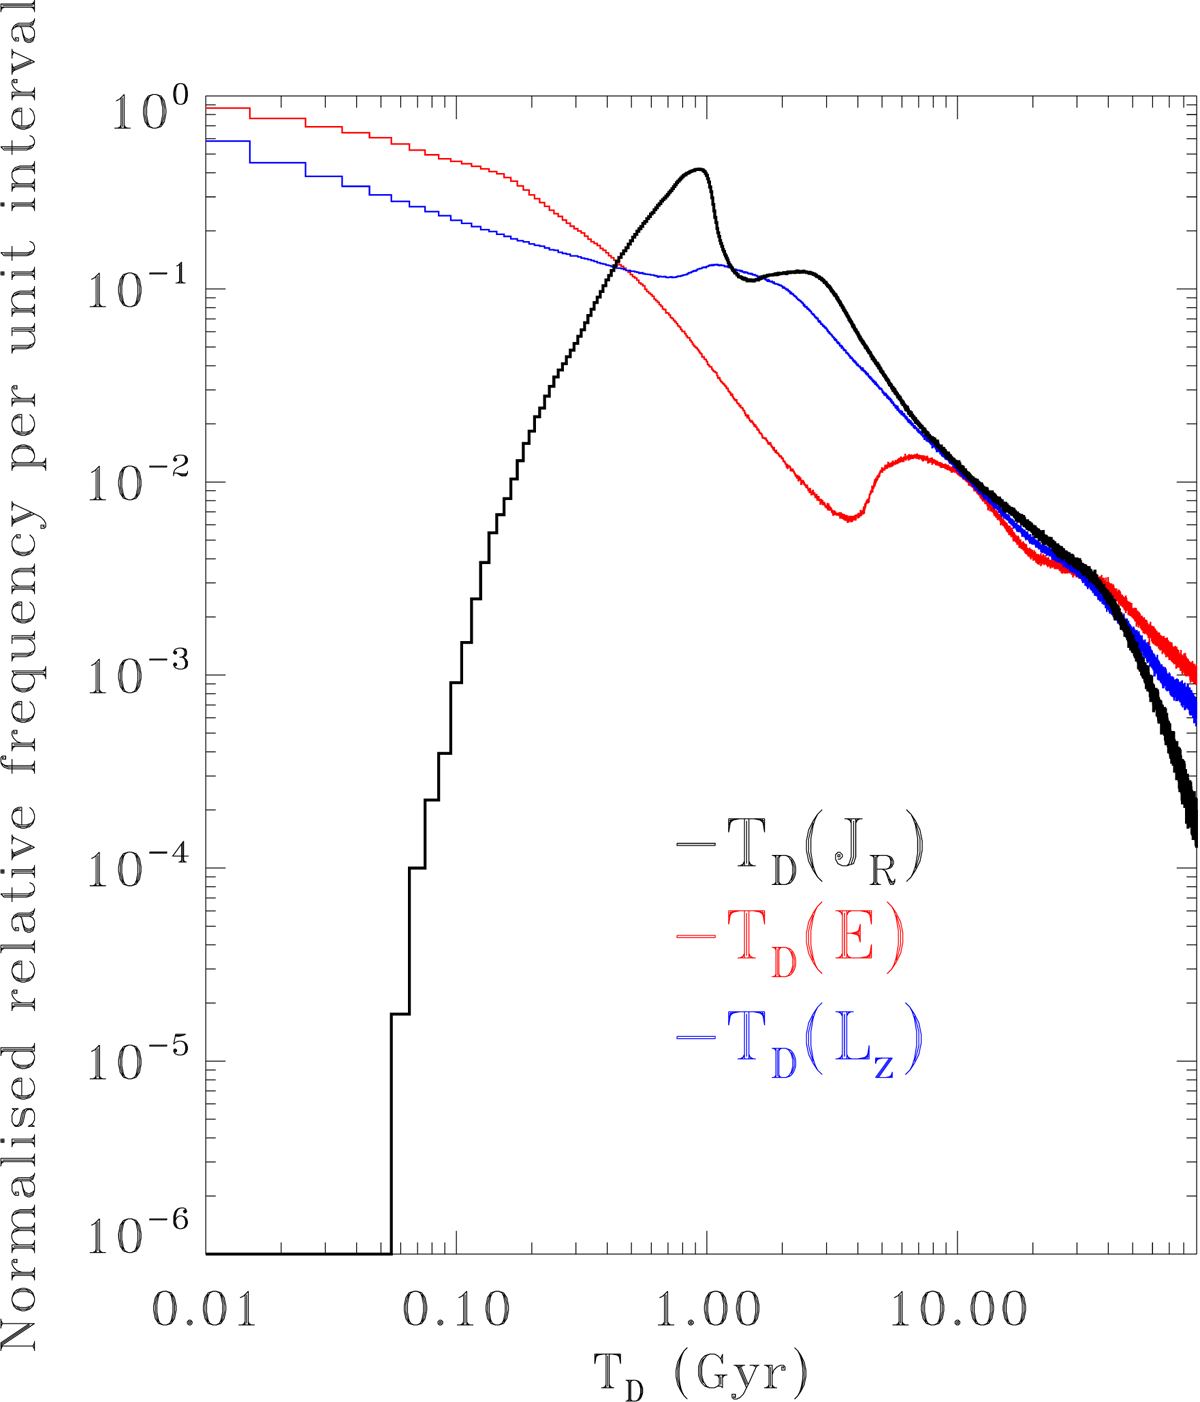
Normalised particle relative frequency per Gyr as a function of TD(JR) (black histogram). A binsize of 0.01 Gyr has been used. One particle thus represents a probability density of 2.5 × 10⁻⁶ Gyr−1. Distributions for TD(E) (red) and TD(Lz) (blue) are plotted for comparison purposes.
Current usage metrics show cumulative count of Article Views (full-text article views including HTML views, PDF and ePub downloads, according to the available data) and Abstracts Views on Vision4Press platform.
Data correspond to usage on the plateform after 2015. The current usage metrics is available 48-96 hours after online publication and is updated daily on week days.
Initial download of the metrics may take a while.