Fig. 3.
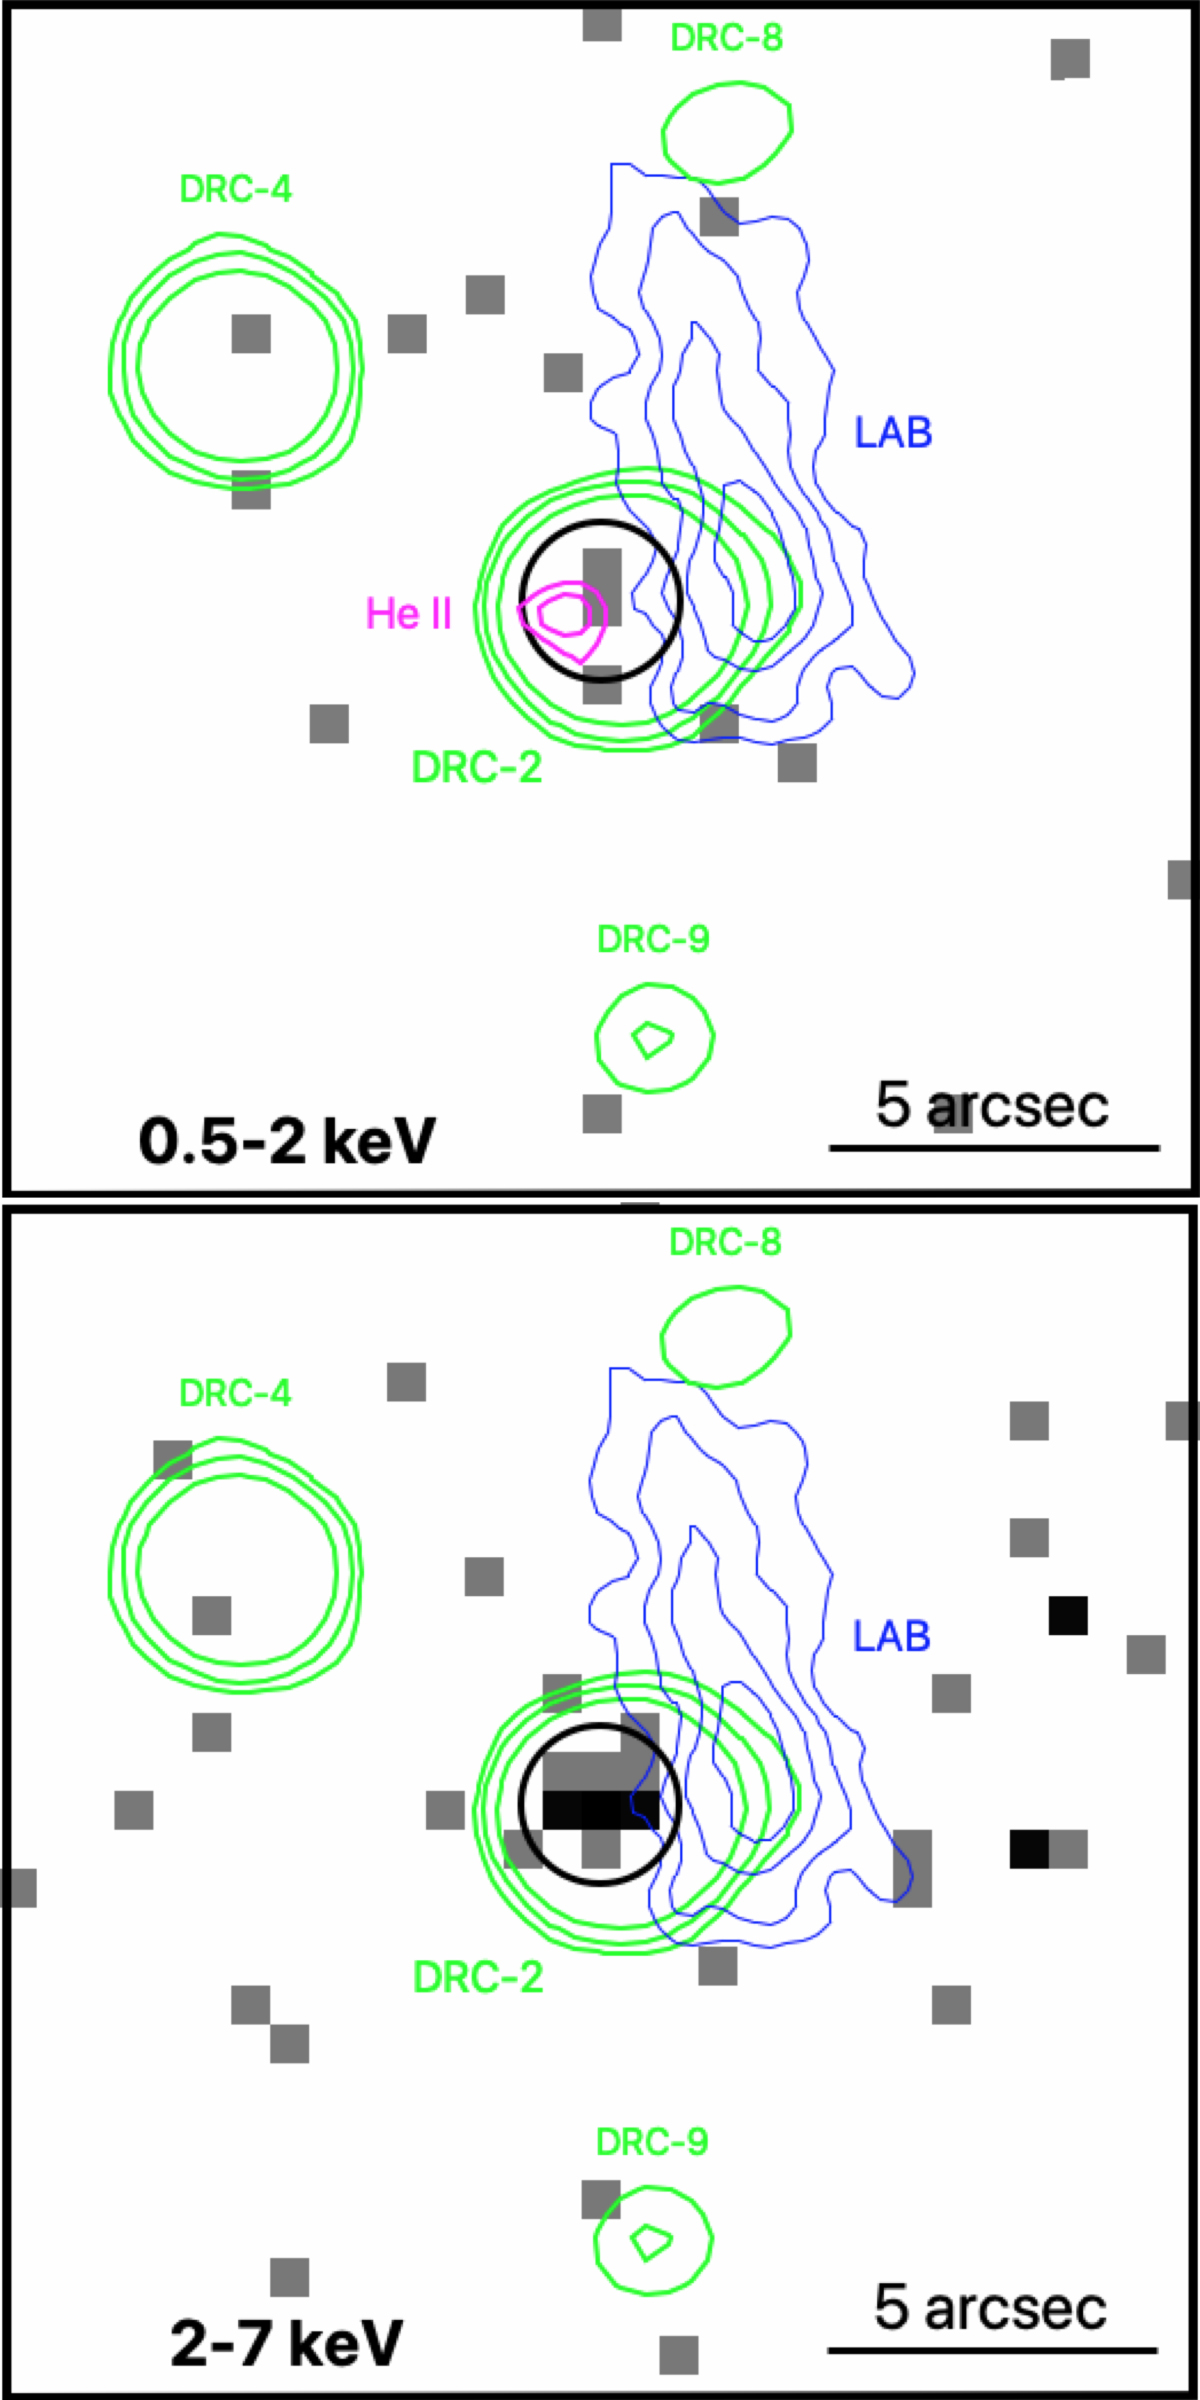
Chandra soft-band (top panel) and hard-band (bottom panel) images of DRC-2. The black circle is the region used for X-ray photometry evaluation, centered on the X-ray emission. Green contours indicate the ALMA emission at 2 mm. The continuum-subtracted emission of the Lyα blob (LAB) is shown with blue contours (see Sect. 4.4). Upper panel: we also show the contours of the He II emission (4σ and 5σ) at the position of DRC-2 (see Sect. 4.3).
Current usage metrics show cumulative count of Article Views (full-text article views including HTML views, PDF and ePub downloads, according to the available data) and Abstracts Views on Vision4Press platform.
Data correspond to usage on the plateform after 2015. The current usage metrics is available 48-96 hours after online publication and is updated daily on week days.
Initial download of the metrics may take a while.