Fig. B.1.
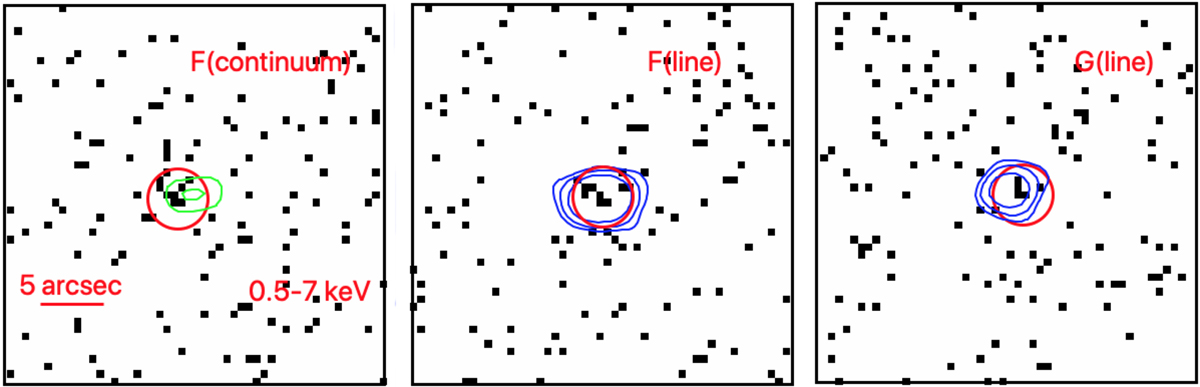
Full-band 25″ × 25″ images of the X-ray detected, spectroscopically unidentified ALMA sources in the outskirts of the DRC field (Ivison et al. 2020). The R = 2″ red circles are centered on the X-ray positions. The green contours mark the 3 mm emission of the continuum source in the field of sub-mm source F. Blue contours mark the CO(4-3) line emission for the unidentified line emitters (not matched with continuum emission) in the fields of sub-mm sources F and G (see Ivison et al. 2020 for details).
Current usage metrics show cumulative count of Article Views (full-text article views including HTML views, PDF and ePub downloads, according to the available data) and Abstracts Views on Vision4Press platform.
Data correspond to usage on the plateform after 2015. The current usage metrics is available 48-96 hours after online publication and is updated daily on week days.
Initial download of the metrics may take a while.