Fig. A.1.
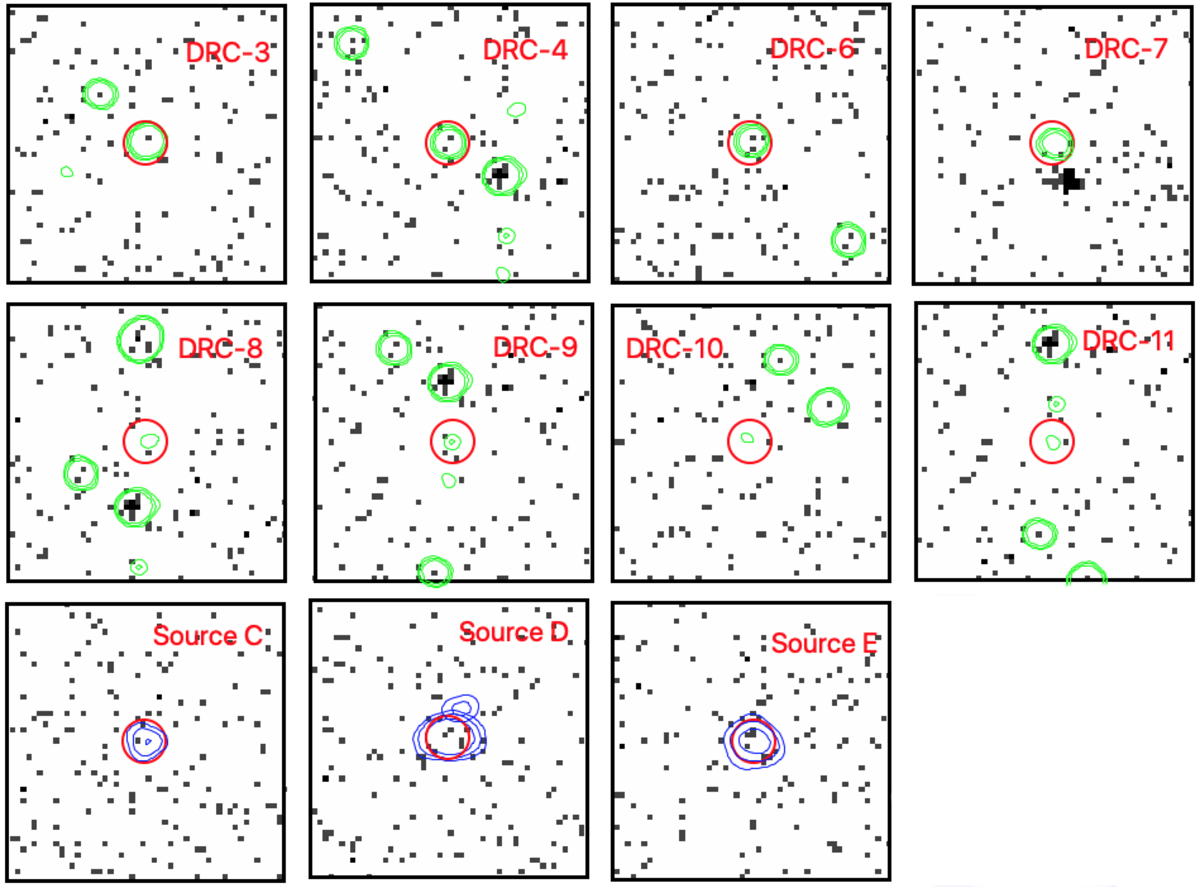
Full-band 25″ × 25″ images of the individually undetected, spectroscopically confirmed members of the protocluster. The R = 2″ red circles are centered at the ALMA positions. Green contours mark the continuum emission at 2 mm of the sources in the core of the structure, as in Fig. 1. Sources in the outskirts of the protoclusters are marked with CO(4-3) contours (3σ, 5σ, and 9σ), since most of them are not associated with continuum emission (Ivison et al. 2020). In the field of source D, a second line emitter (≈3″ from the primary source; Δv ≈ 1700 km s−1) was found and discussed by Ivison et al. (2020). It is not clear if this is another protocluster member, or if it is part of source D (e.g., an outflowing component).
Current usage metrics show cumulative count of Article Views (full-text article views including HTML views, PDF and ePub downloads, according to the available data) and Abstracts Views on Vision4Press platform.
Data correspond to usage on the plateform after 2015. The current usage metrics is available 48-96 hours after online publication and is updated daily on week days.
Initial download of the metrics may take a while.