Fig. 4.
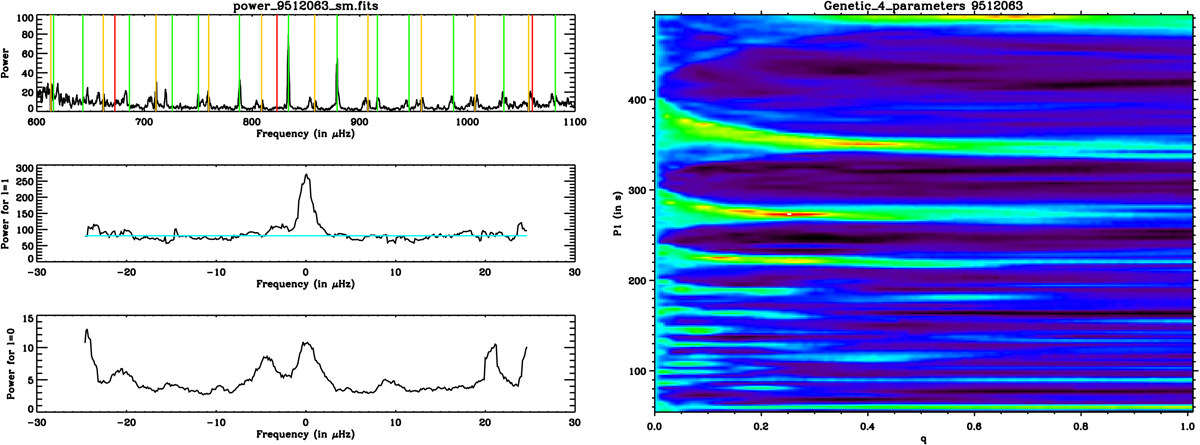
Left, top: power spectrum as a function of the frequency for KIC 9512063. The power spectrum is compensated for the p-mode envelope power. The vertical orange lines indicate the location of the l = 0 modes for which the power was set to zero. The vertical green lines indicate the location of the dipole mixed modes. The vertical red lines indicate the location of the gravity modes. Left, middle: superposed power as a function of the frequency for the dipole modes (l = 1); the horizontal cyan line indicates the level of noise. Left, bottom: superposed power as a function of the frequency for the l = 0 modes. Right: map of the figure of merit for (P1, q) with all other parameters fixed.
Current usage metrics show cumulative count of Article Views (full-text article views including HTML views, PDF and ePub downloads, according to the available data) and Abstracts Views on Vision4Press platform.
Data correspond to usage on the plateform after 2015. The current usage metrics is available 48-96 hours after online publication and is updated daily on week days.
Initial download of the metrics may take a while.