Fig. 5
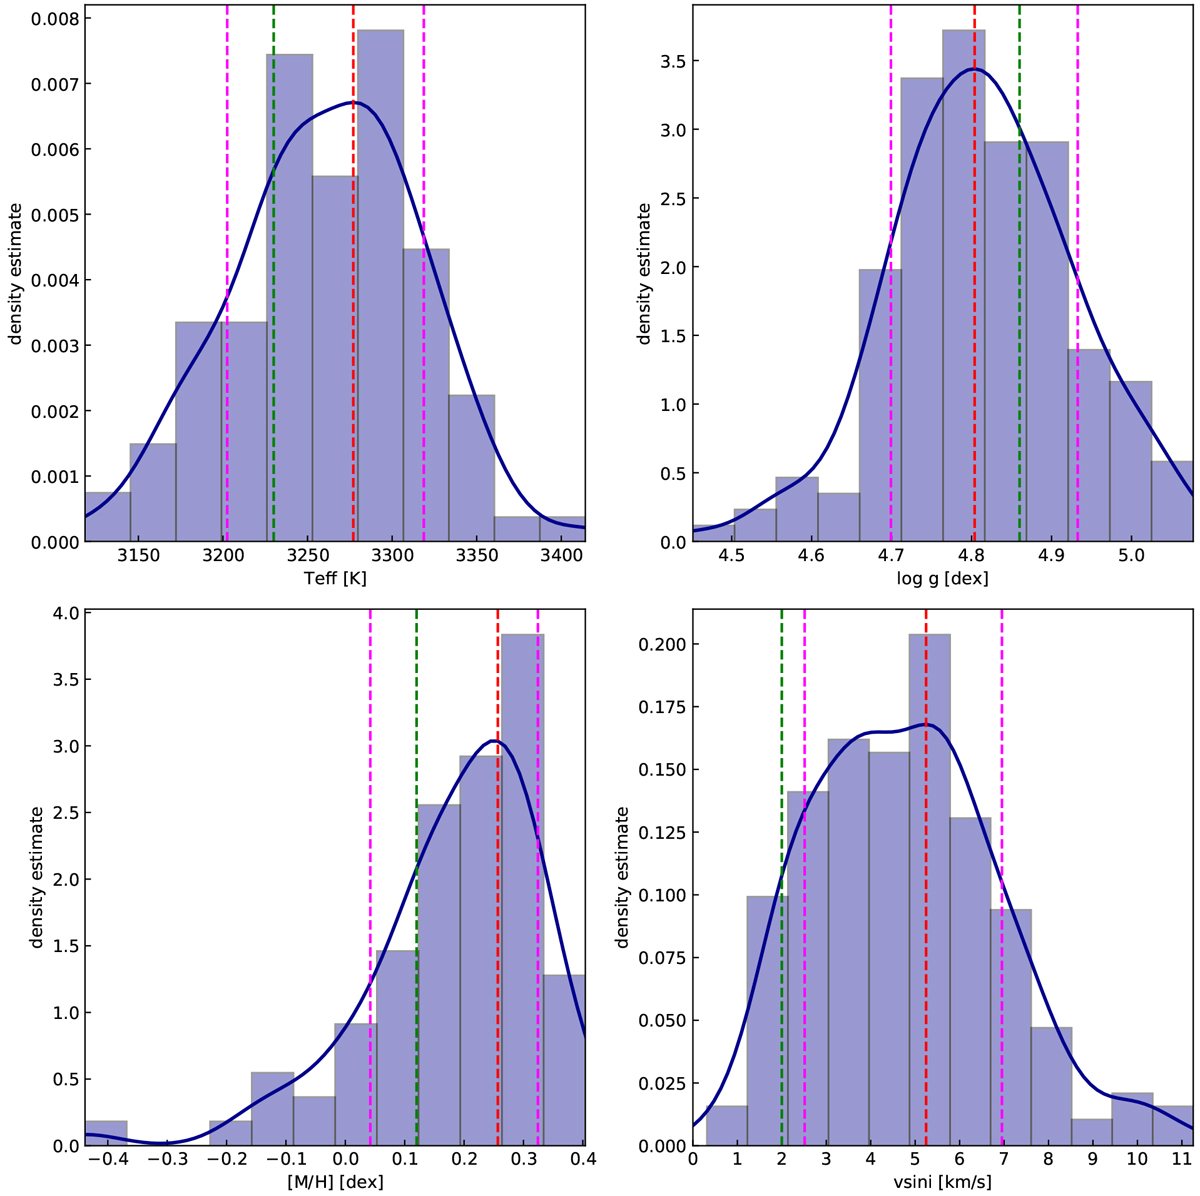
DL estimations distribution for the CARMENES star GJ 169.1A (J04311+589). The KDE maximum (i.e., our adopted estimations, red lines) is shown together with the 1σ uncertainties (magenta lines) and results from Pass19 (green lines). The dark blue curve represents the Gaussian kernel density estimate. We used the default rules from the seaborn distplot function: Freedman-Diaconis’ (Freedman & Diaconis 1981) for the histogram bin width and Scott’s rule (Scott 1979) for the kernel size.
Current usage metrics show cumulative count of Article Views (full-text article views including HTML views, PDF and ePub downloads, according to the available data) and Abstracts Views on Vision4Press platform.
Data correspond to usage on the plateform after 2015. The current usage metrics is available 48-96 hours after online publication and is updated daily on week days.
Initial download of the metrics may take a while.