Free Access
Fig. 2
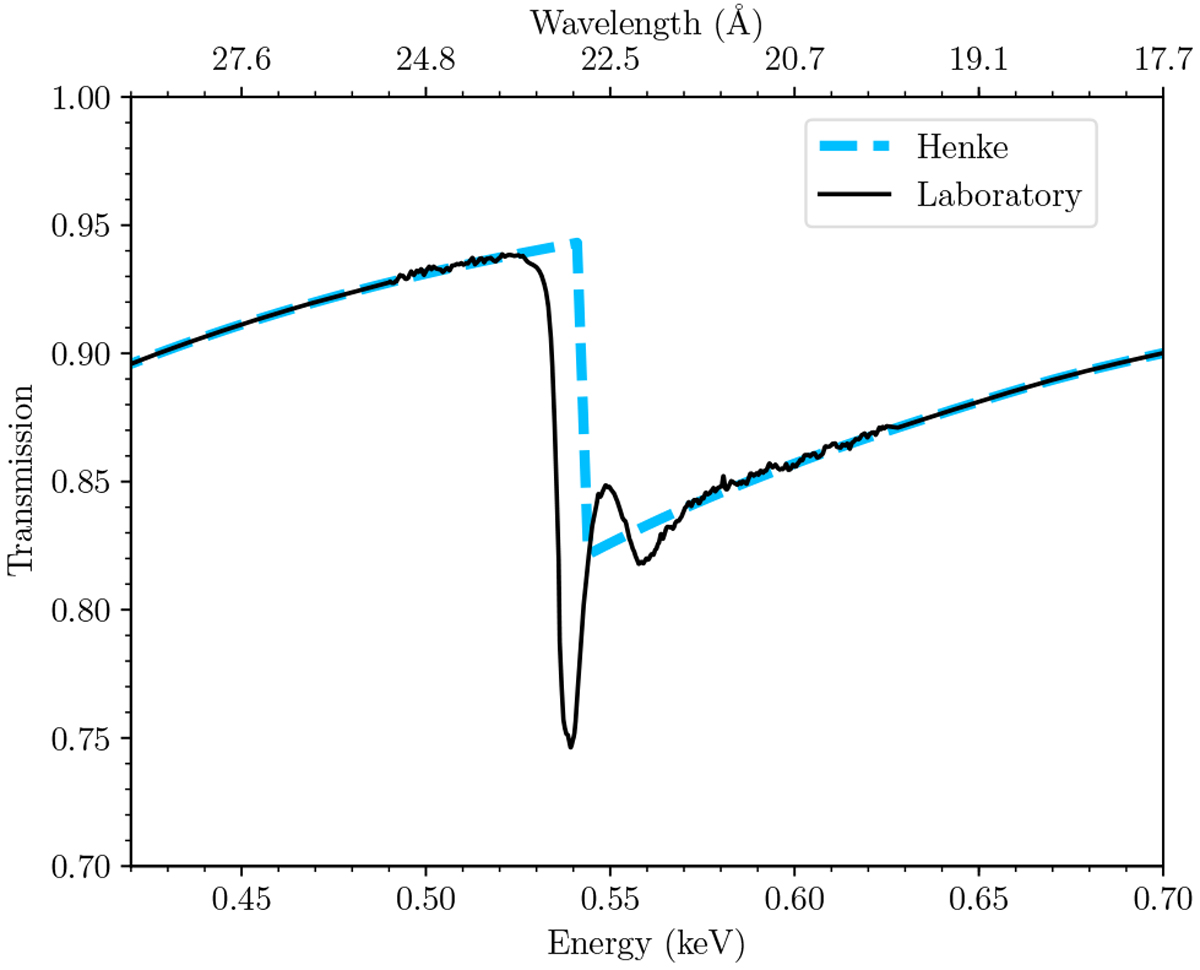
Transmission spectrum in the oxygen K-edge using an amorphous olivine dust compound (solid black line). The dashed blueline indicates the tabulated data found in Henke et al. (1993), which were used to fit the pre-edge and post-edge of the data.
Current usage metrics show cumulative count of Article Views (full-text article views including HTML views, PDF and ePub downloads, according to the available data) and Abstracts Views on Vision4Press platform.
Data correspond to usage on the plateform after 2015. The current usage metrics is available 48-96 hours after online publication and is updated daily on week days.
Initial download of the metrics may take a while.