Free Access
Fig. 1
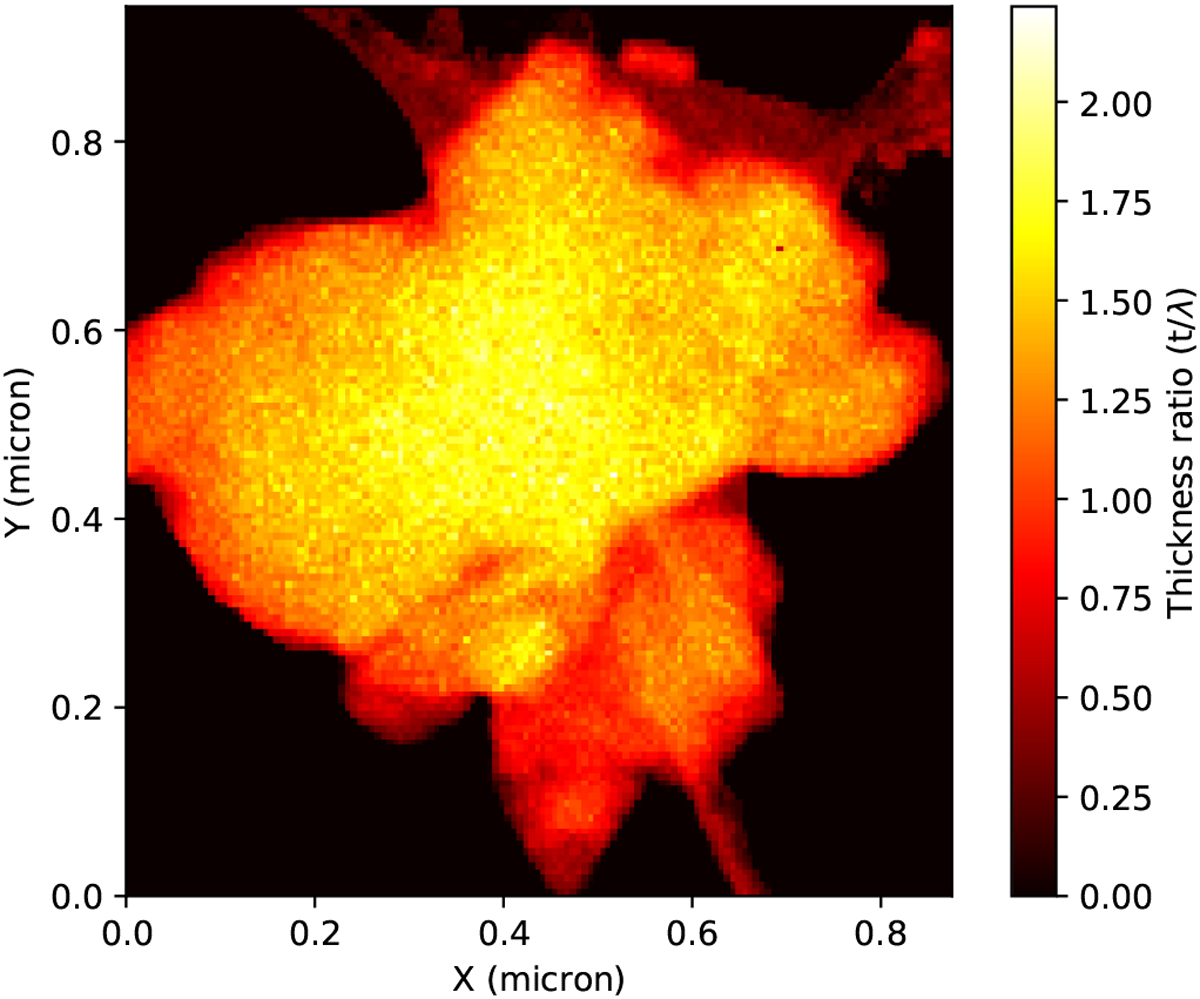
Example of the region of interest of the dust sample obtained from laboratory data. The colourbar of the image indicates thethickness ratio ![]() , where t
is the thickness and
, where t
is the thickness and ![]() the mean free path of the inelastic scattering.
the mean free path of the inelastic scattering.
Current usage metrics show cumulative count of Article Views (full-text article views including HTML views, PDF and ePub downloads, according to the available data) and Abstracts Views on Vision4Press platform.
Data correspond to usage on the plateform after 2015. The current usage metrics is available 48-96 hours after online publication and is updated daily on week days.
Initial download of the metrics may take a while.