Fig. 5
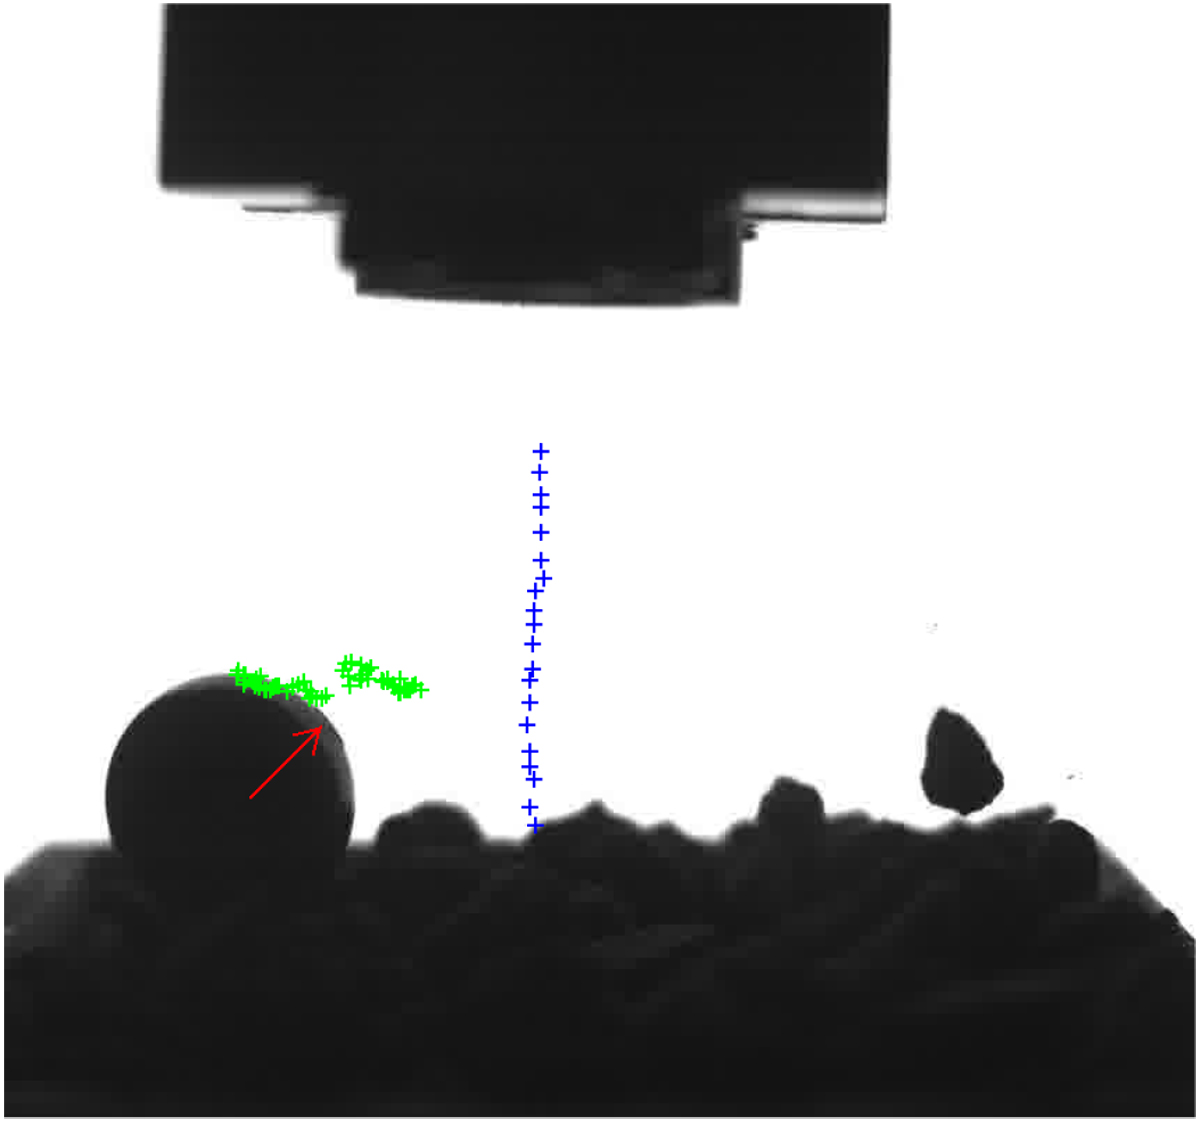
Tracked trajectory of projectile before (blue points) and after (green points) impact for Drop ID 2017-08-30-1. At the top of the image, we can see the launch mechanism that released the projectile in a normal trajectory toward the sample. Before the impact, the bottom of the projectile is tracked to optimally detect contact with the sample, while the top of the projectile is tracked after impact. The projectile motion after impact follows the rough surface of the target material toward the left side of the image. To the right of the image, we can see one ejected particle leaving the target. The red arrow indicates a trackable feature at the surface of the projectile, which was used to verify actual rotation of the projectile during the rolling motion.
Current usage metrics show cumulative count of Article Views (full-text article views including HTML views, PDF and ePub downloads, according to the available data) and Abstracts Views on Vision4Press platform.
Data correspond to usage on the plateform after 2015. The current usage metrics is available 48-96 hours after online publication and is updated daily on week days.
Initial download of the metrics may take a while.