Fig. 14
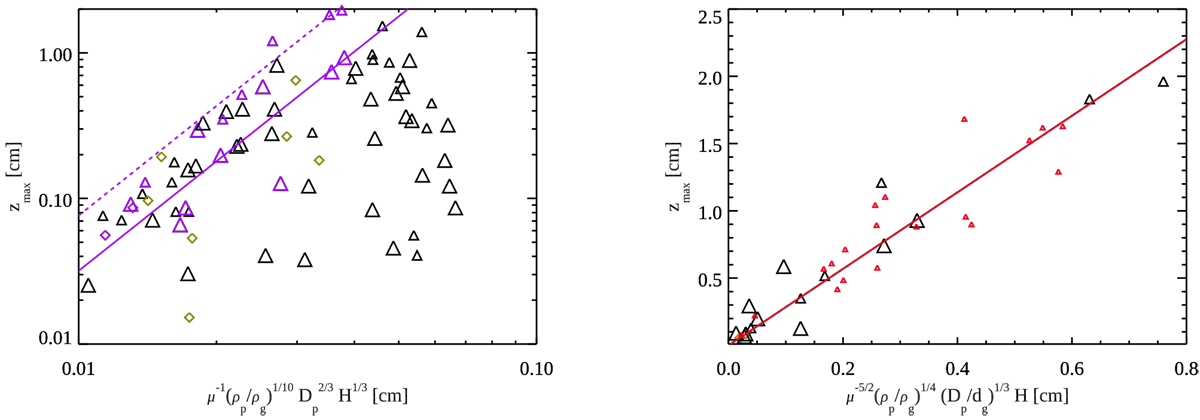
Maximum penetration depth scaling: (left) maximum penetration depth in dependence of the scaling quantity
![]() (see text for details). Symbol size and color are the same as in Fig. 9. Purple symbols denote impacts for which rebound was observed without rolling, and purple lines are exponential fits to this subset of data. The fit indices are 2.3 (dashed) and 2.6 (full line) for mm- and cm-sized grain targets, respectively; (right) maximum penetration depth scaling adjusted for inclusion of the target grain size. Red symbols show the fine grain data points collected in Brisset et al. (2018). The three data sets (0.25, 1, and 13 mm grains) are proportional to the quantity
(see text for details). Symbol size and color are the same as in Fig. 9. Purple symbols denote impacts for which rebound was observed without rolling, and purple lines are exponential fits to this subset of data. The fit indices are 2.3 (dashed) and 2.6 (full line) for mm- and cm-sized grain targets, respectively; (right) maximum penetration depth scaling adjusted for inclusion of the target grain size. Red symbols show the fine grain data points collected in Brisset et al. (2018). The three data sets (0.25, 1, and 13 mm grains) are proportional to the quantity
![]() with a factor of 2.84.
with a factor of 2.84.
Current usage metrics show cumulative count of Article Views (full-text article views including HTML views, PDF and ePub downloads, according to the available data) and Abstracts Views on Vision4Press platform.
Data correspond to usage on the plateform after 2015. The current usage metrics is available 48-96 hours after online publication and is updated daily on week days.
Initial download of the metrics may take a while.