Fig. 10
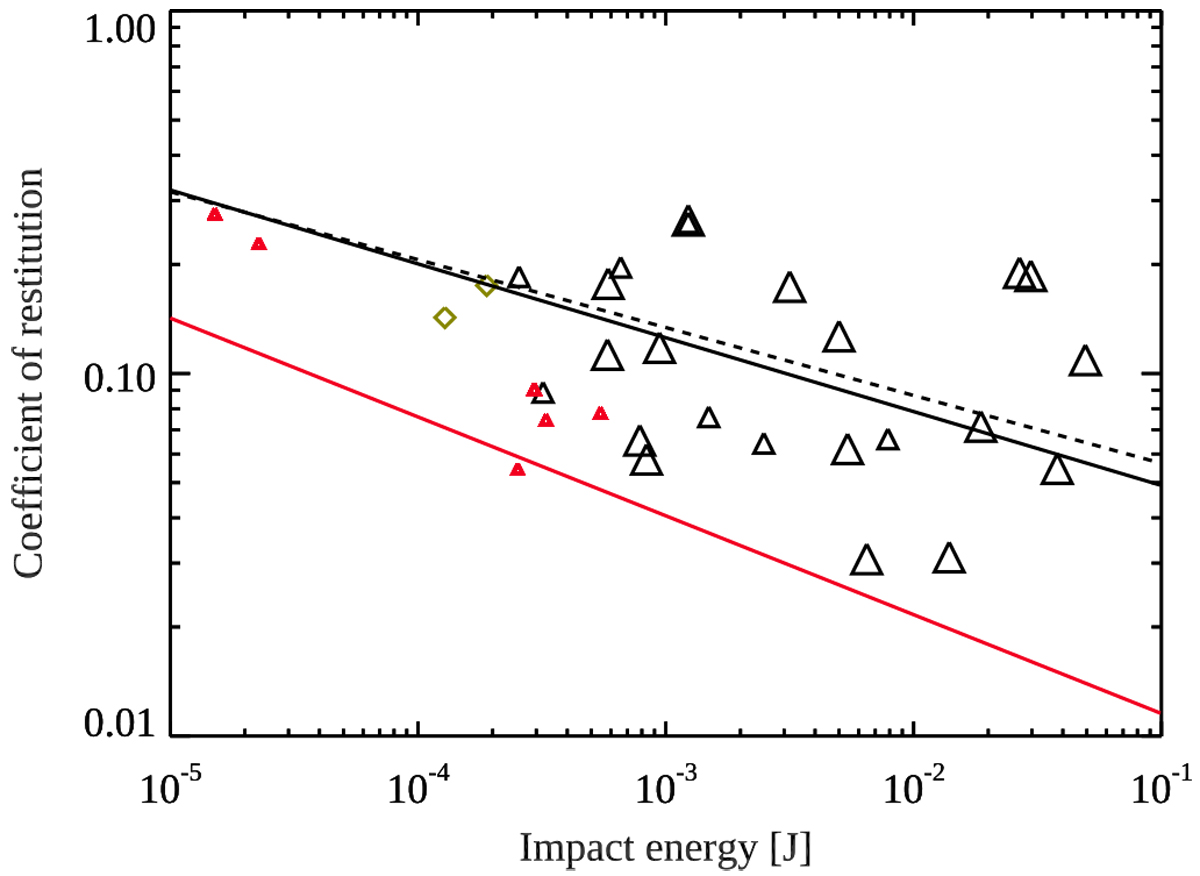
Coefficient of restitution for normal rebound impact outcomes, neglecting rolling outcomes. Symbols and lines are the same as in Fig. 9. The exponential fit indices are −0.19 and −0.20 for mm- and cm-sized grain targets, respectively. The red line shows the COR fit for impacts into fine grain targets (Brisset et al. 2018). Red data points show individual COR values for these impacts, selected for JSC-1 targets and microgravity condition only.
Current usage metrics show cumulative count of Article Views (full-text article views including HTML views, PDF and ePub downloads, according to the available data) and Abstracts Views on Vision4Press platform.
Data correspond to usage on the plateform after 2015. The current usage metrics is available 48-96 hours after online publication and is updated daily on week days.
Initial download of the metrics may take a while.