Fig. 6.
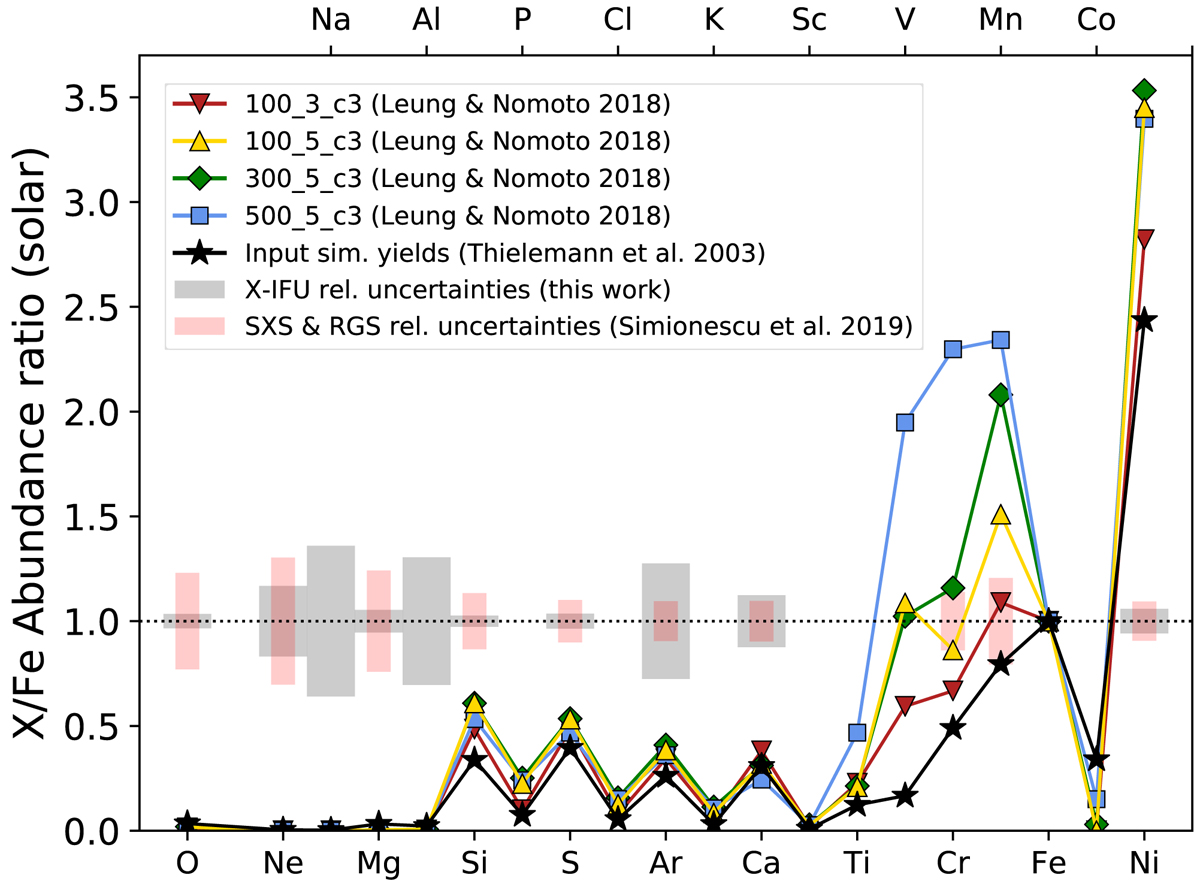
Comparison of various X/Fe abundance ratios predicted by the SNIa yield models used in our top five “SNIa model” best fits (Table 3). Upper and lower horizontal axes mark respectively the odd- and even-Z elements. For comparison, we also show the relative (i.e. normalised to 1) observational uncertainties on the X/Fe ratios derived (i) in this work using the X-IFU (12 ratios, as tracked by our input simulations, C and N are not shown here), and (ii) using ∼300 ks of Hitomi/SXS (in synergy with ∼200 ks of XMM-Newton/RGS) exposure (Simionescu et al. 2019).
Current usage metrics show cumulative count of Article Views (full-text article views including HTML views, PDF and ePub downloads, according to the available data) and Abstracts Views on Vision4Press platform.
Data correspond to usage on the plateform after 2015. The current usage metrics is available 48-96 hours after online publication and is updated daily on week days.
Initial download of the metrics may take a while.