Fig. 2.
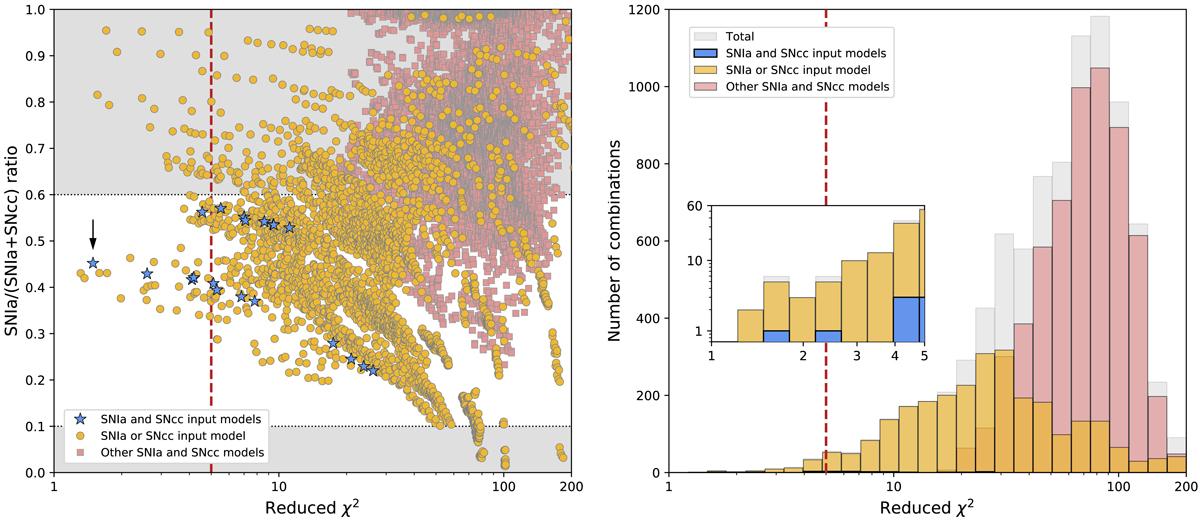
Left: best-fit ![]() versus the SNIa fraction for all the possible combinations of (AGB+SNcc+SNIa) yield models, fitted on the averaged X-IFU mock abundance ratios (see text). Combinations using (i) both SNcc and SNIa models from the input cosmological simulations (blue stars), (ii) one of these models (for either SNcc or SNIa; yellow circles), and (iii) neither of these models (pink squares) are shown separately. The black arrow shows the “input” combination detailed in Fig. 1 and discussed in Sect. 3.1. The white area delimitates realistic observational constraints previously obtained on the SNIa fraction contributing to the enrichment (see text). The dashed red line shows the “statistically acceptable” models (
versus the SNIa fraction for all the possible combinations of (AGB+SNcc+SNIa) yield models, fitted on the averaged X-IFU mock abundance ratios (see text). Combinations using (i) both SNcc and SNIa models from the input cosmological simulations (blue stars), (ii) one of these models (for either SNcc or SNIa; yellow circles), and (iii) neither of these models (pink squares) are shown separately. The black arrow shows the “input” combination detailed in Fig. 1 and discussed in Sect. 3.1. The white area delimitates realistic observational constraints previously obtained on the SNIa fraction contributing to the enrichment (see text). The dashed red line shows the “statistically acceptable” models (![]() , see text). The list of best-fit models is provided in Table 3. Right:
, see text). The list of best-fit models is provided in Table 3. Right: ![]() distribution of the same combinations. The same colour code as the left panel is applied.
distribution of the same combinations. The same colour code as the left panel is applied.
Current usage metrics show cumulative count of Article Views (full-text article views including HTML views, PDF and ePub downloads, according to the available data) and Abstracts Views on Vision4Press platform.
Data correspond to usage on the plateform after 2015. The current usage metrics is available 48-96 hours after online publication and is updated daily on week days.
Initial download of the metrics may take a while.