Fig. 1.
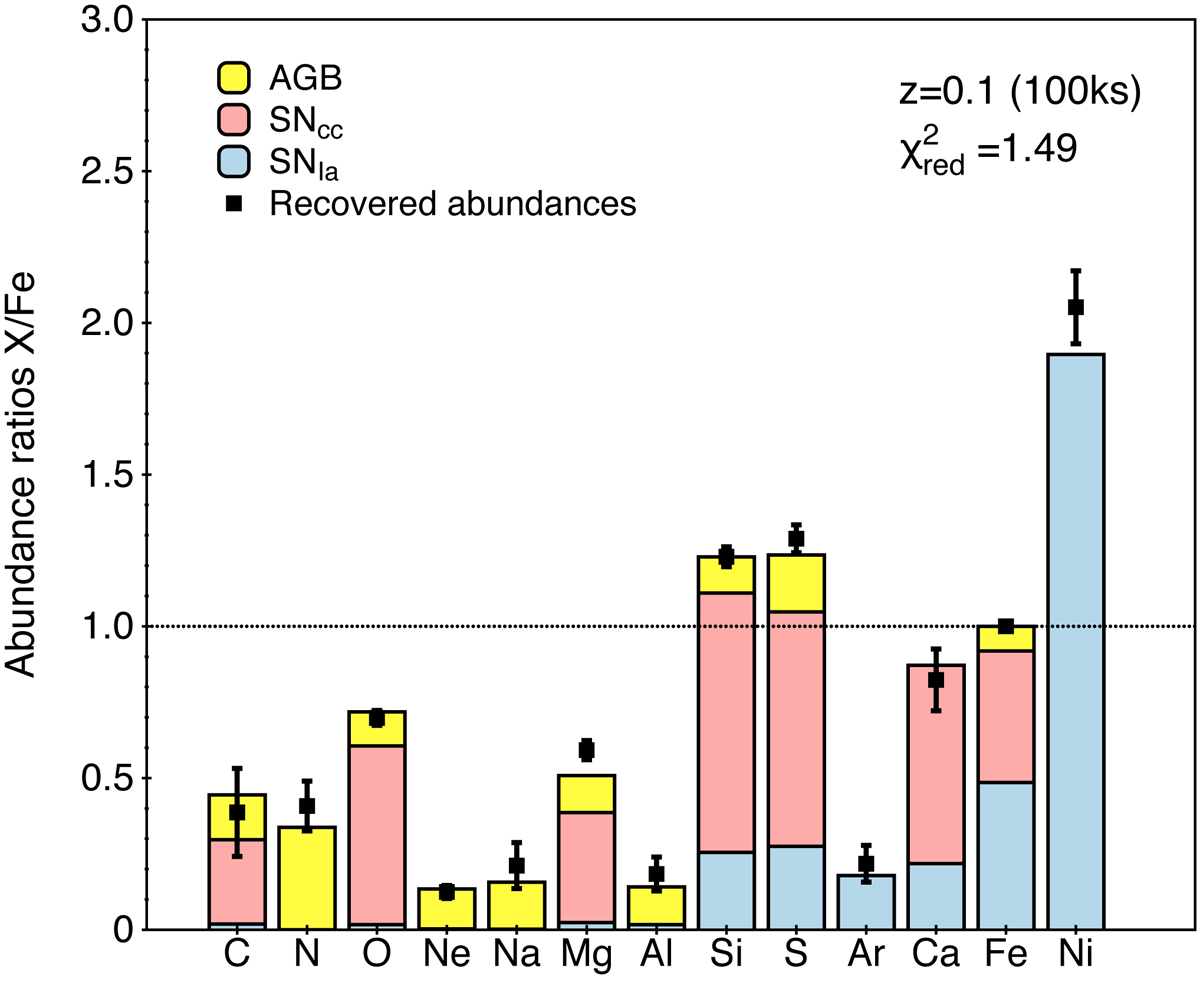
Average abundance ratio X/Fe within R500 over the cluster sample for z = 0.1 recovered using 100 ks observations. These values are fitted using the enrichment yields derived from the references provided in Paper I. The corresponding fitted contributions of SNIa (blue), SNcc (magenta), and AGB stars (yellow) are shown as histograms.
Current usage metrics show cumulative count of Article Views (full-text article views including HTML views, PDF and ePub downloads, according to the available data) and Abstracts Views on Vision4Press platform.
Data correspond to usage on the plateform after 2015. The current usage metrics is available 48-96 hours after online publication and is updated daily on week days.
Initial download of the metrics may take a while.