Fig. 9.
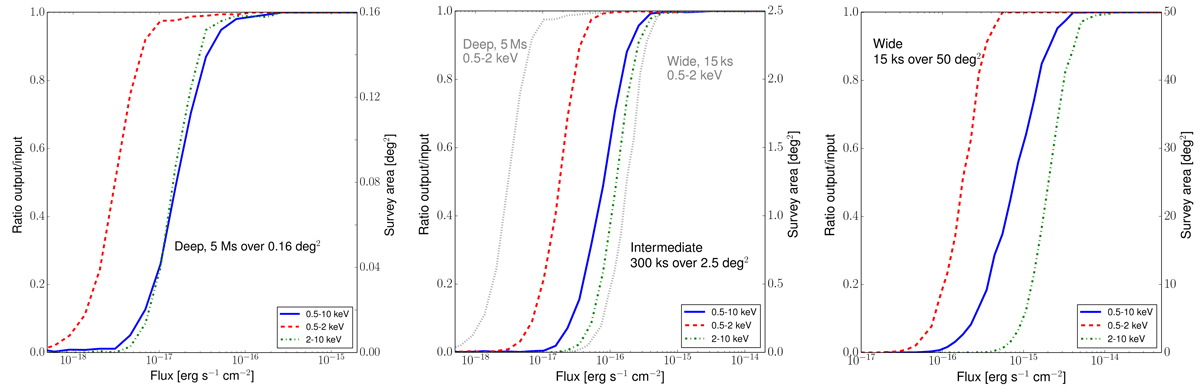
Survey completeness, that is, ratio between number of detected sources and number of simulated sources, and corresponding survey area for AGNs detected in the 0.5–7 keV (solid blue line), 0.5–2 keV (dashed red line) and 2–7 keV (dash-dotted green line). In the left panel we report the curves obtained in the AXIS deep survey, in the central panel those obtained in the intermediate-area survey, and in the right panel those obtained in the wide-area survey. In the central panel, the 0.5–2 keV completeness curves for the deep and wide surveys (dotted gray lines) are also plotted for comparison.
Current usage metrics show cumulative count of Article Views (full-text article views including HTML views, PDF and ePub downloads, according to the available data) and Abstracts Views on Vision4Press platform.
Data correspond to usage on the plateform after 2015. The current usage metrics is available 48-96 hours after online publication and is updated daily on week days.
Initial download of the metrics may take a while.