Fig. 7.
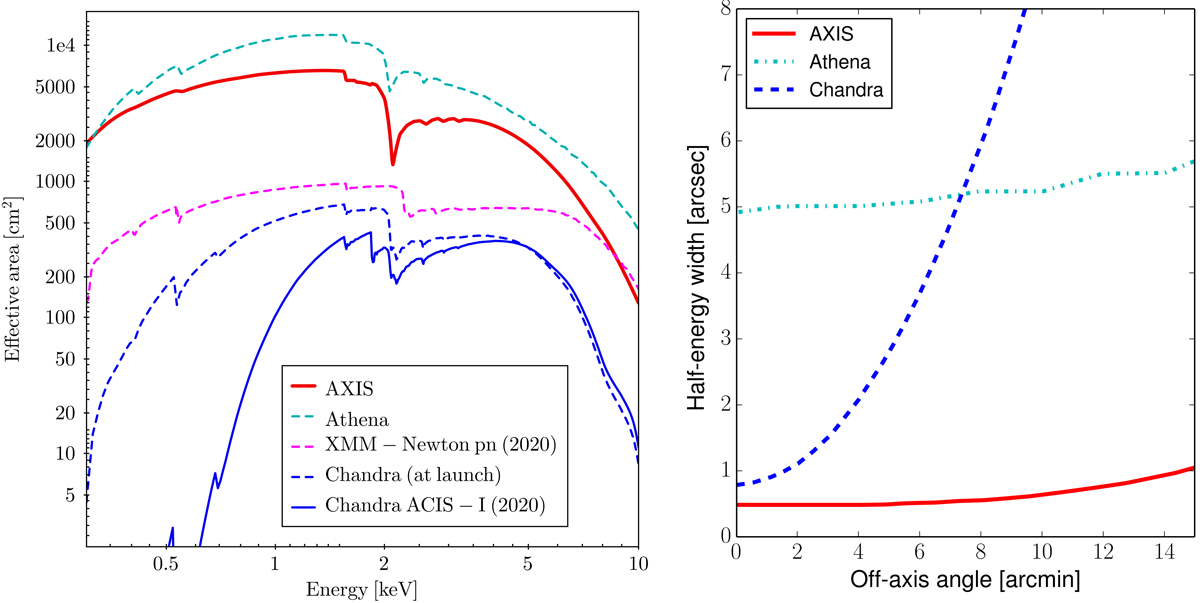
Left: AXIS planned effective area as a function of energy (red solid red line), compared with those of the XMM-Newton pn camera (dashed magenta line) and of the Chandra ACIS-I camera (dashed blue line) as of early 2020, and with the ACIS-I one at the time Chandra was launched (solid blue line). The ATHENA effective area for a 5′ field of view (dashed cyan line) is also plotted for comparison. Right: AXIS (solid red line) angular resolution as a function of the off-axis angle. The same quantities are also plotted for ATHENA–WFI (dash-dotted cyan line; Nandra et al. 2013) and Chandra ACIS-I (dashed blue line).
Current usage metrics show cumulative count of Article Views (full-text article views including HTML views, PDF and ePub downloads, according to the available data) and Abstracts Views on Vision4Press platform.
Data correspond to usage on the plateform after 2015. The current usage metrics is available 48-96 hours after online publication and is updated daily on week days.
Initial download of the metrics may take a while.