Fig. 6.
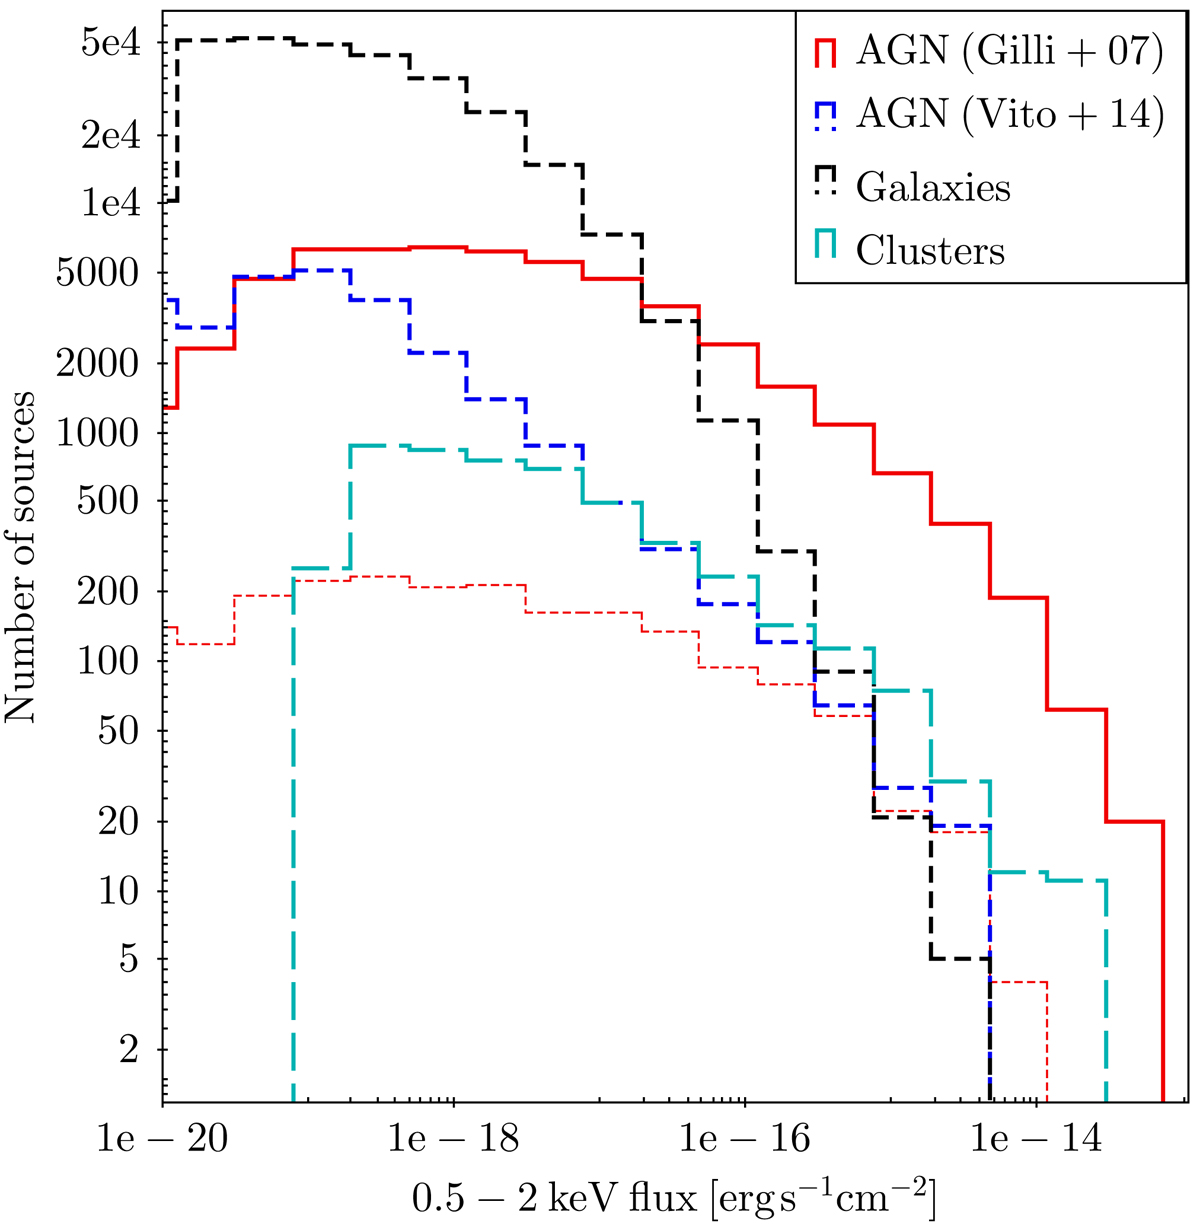
Distribution of the 0.5–2 keV flux for the four mocks presented in this work: AGN from the Gilli et al. (2007) AGN population synthesis model (red solid line for the whole population; red dotted line for the z > 3 subsample); z > 3 AGN from the Vito et al. (2014) X-ray luminosity function (blue long-dashed line); nonactive galaxies (black short-dashed line); and clusters of galaxies (cyan long dashed line). All histograms refer to a 1 deg2 field.
Current usage metrics show cumulative count of Article Views (full-text article views including HTML views, PDF and ePub downloads, according to the available data) and Abstracts Views on Vision4Press platform.
Data correspond to usage on the plateform after 2015. The current usage metrics is available 48-96 hours after online publication and is updated daily on week days.
Initial download of the metrics may take a while.