Fig. 5.
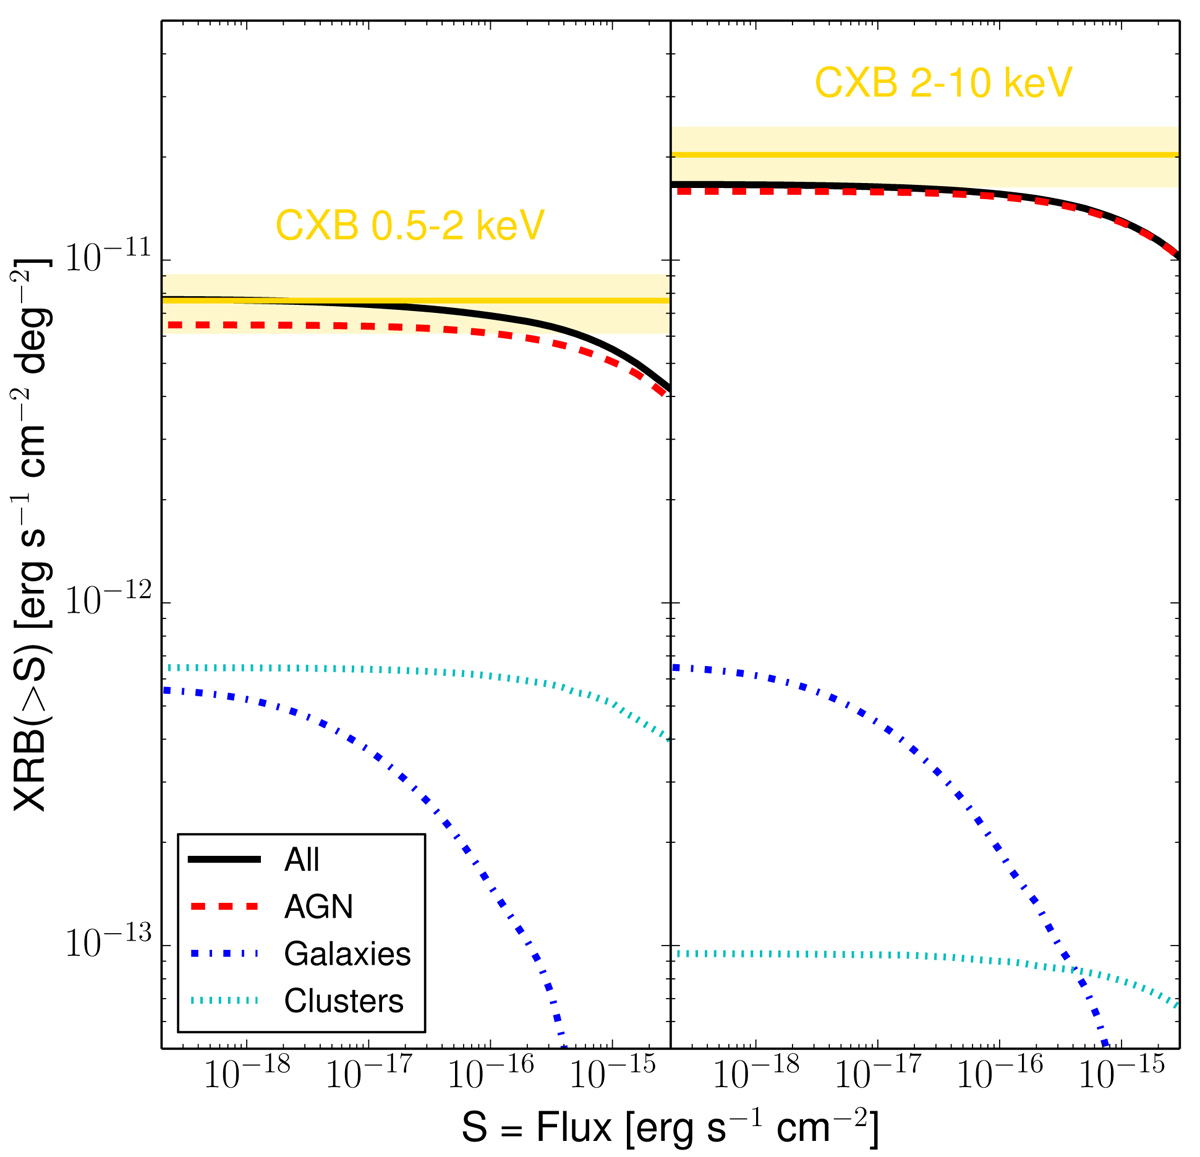
Cumulative 0.5–2 keV (left) and 2–10 keV (right) fluxes per unit of square degree of the AGNs (dashed red line), nonactive galaxies (dash-dotted blue line) and galaxy clusters (dotted cyan line) simulated for the mocks used in this work. The overall distribution is plotted as a solid black line. The flux of the cosmic X-ray background measured by Cappelluti et al. (2017) is plotted in yellow, with 20% errors to account for the uncertainties in the CXB absolute flux level measured by different instruments.
Current usage metrics show cumulative count of Article Views (full-text article views including HTML views, PDF and ePub downloads, according to the available data) and Abstracts Views on Vision4Press platform.
Data correspond to usage on the plateform after 2015. The current usage metrics is available 48-96 hours after online publication and is updated daily on week days.
Initial download of the metrics may take a while.