Fig. 4.
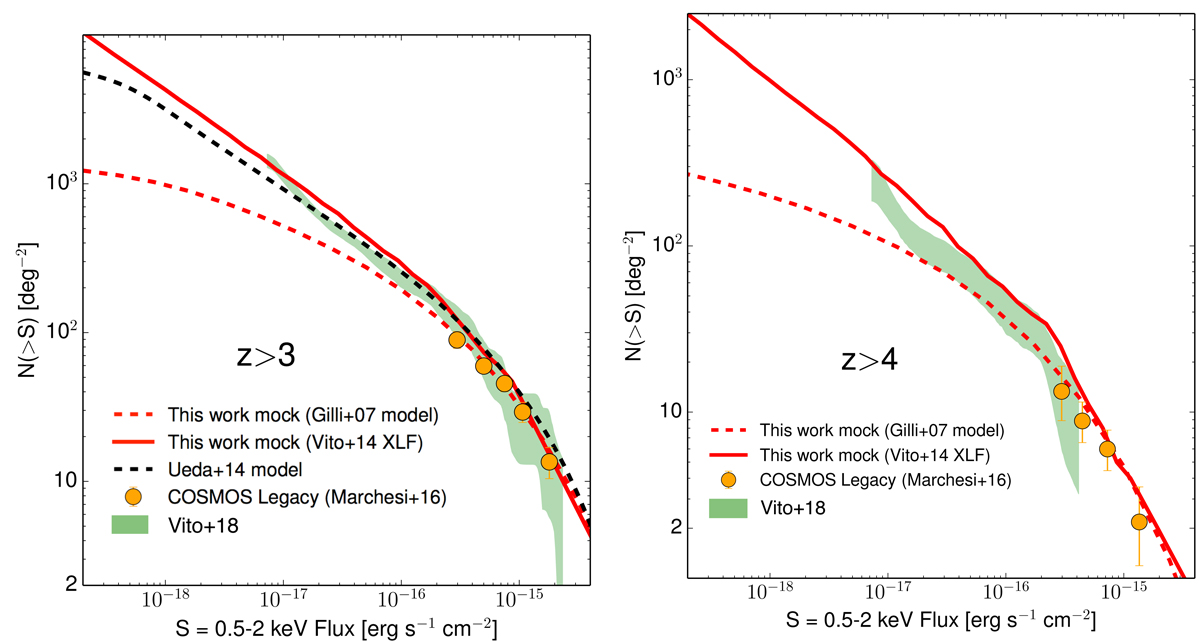
Cumulative 0.5–2 keV number counts at redshift z > 3 (left) and z > 4 (right). The number counts of the mock catalog we derived from the Vito et al. (2014)z > 3 XLF are plotted as a solid red line, while those of the mock derived using the Gilli et al. (2007) CXB model are shown using a dashed red line. The z = [3–5] number counts derived with the Ueda et al. (2014, dashed black line) model are also shown for comparison. Finally, the observational results from Chandra COSMOS Legacy (orange circles, Marchesi et al. 2016b) and from the CDF-S 7 Ms and CDF-N 2 Ms (green shaded area highligting the 68% confidence region; Vito et al. 2018) are also plotted for comparision.
Current usage metrics show cumulative count of Article Views (full-text article views including HTML views, PDF and ePub downloads, according to the available data) and Abstracts Views on Vision4Press platform.
Data correspond to usage on the plateform after 2015. The current usage metrics is available 48-96 hours after online publication and is updated daily on week days.
Initial download of the metrics may take a while.