Free Access
Fig. 3.
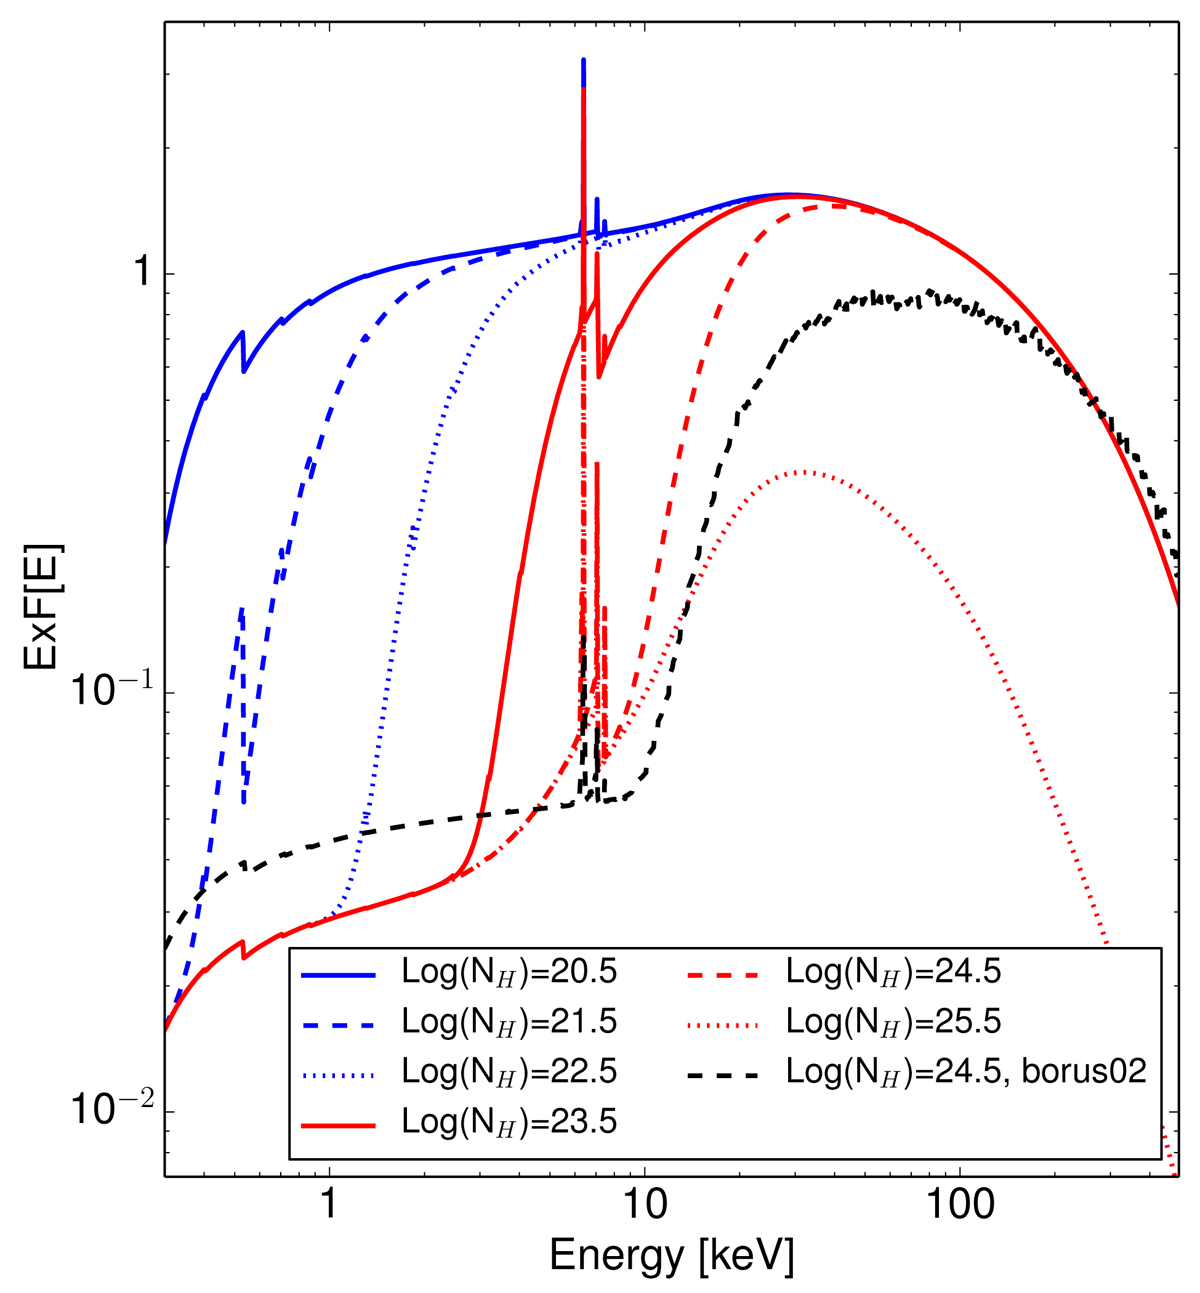
AGN spectra used in our simulations, at z = 0 and for different log(NH) values. We also plot the spectrum of a CT-AGN with log(NH) = 24.5 as modeled using the borus02 model (Baloković et al. 2018, dashed black line), as a reference.
Current usage metrics show cumulative count of Article Views (full-text article views including HTML views, PDF and ePub downloads, according to the available data) and Abstracts Views on Vision4Press platform.
Data correspond to usage on the plateform after 2015. The current usage metrics is available 48-96 hours after online publication and is updated daily on week days.
Initial download of the metrics may take a while.