Fig. 2.
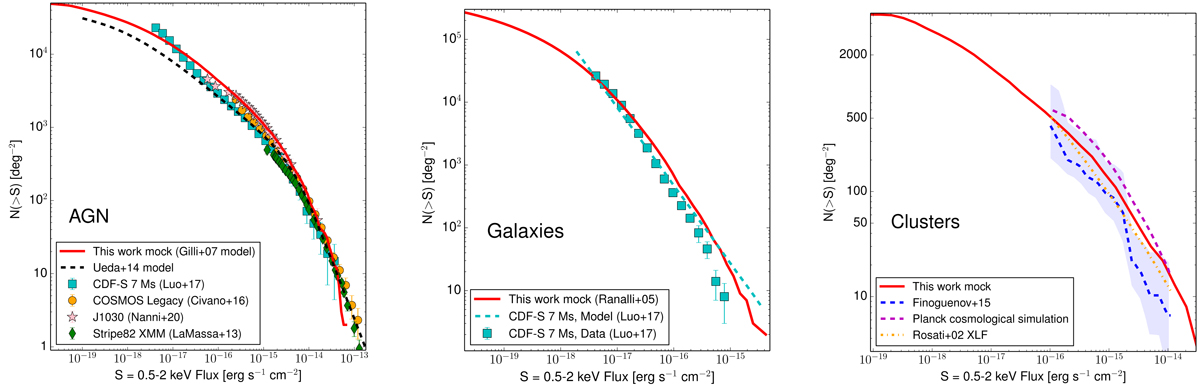
Left: cumulative AGN number counts as a function of the 0.5–2 keV flux. The number counts from our mock catalog, derived using the Gilli et al. (2007) AGN population synthesis model, are plotted as a solid red line. As a comparison, we also plot the number counts derived in the CDF-S 7 Ms (cyan squares; Luo et al. 2017), Chandra COSMOS Legacy (orange circles; Civano et al. 2016), J1030 (pink stars; Nanni et al. 2020), and Stripe 82X (green diamonds; LaMassa et al. 2013b) surveys. The number counts derived from the Ueda et al. (2014) X-ray luminosity function are also shown with a dashed black line, for comparison. We note that the difference at faint fluxes between these number counts and those of our mock is almost completely due to the fact that Ueda et al. (2014) did not include AGNs with luminosities < 1041 erg s−1 in their analysis. Center: cumulative nonactive galaxies number counts as a function of the 0.5–2 keV flux. The number counts from our mock catalog, derived using the Ranalli et al. (2005) luminosity function, are plotted as a solid red line. The observed (cyan squares) and model-inferred number counts (dashed cyan line) derived in the CDF-S 7 Ms (Luo et al. 2017) are also shown for comparison. Right: cumulative galaxy clusters number counts as a function of the 0.5–2 keV flux. The number counts from our mock catalog are plotted as a solid red line. As a comparison, we also plot the number counts derived in the Extended Chandra Deep Field–South field (dashed blue line; the 1σ uncertainty area is shown as a blue shaded area; Finoguenov et al. 2015), and those derived combining data from ROSAT, ASCA and Beppo-SAX surveys (dash-dotted orange line; Rosati et al. 2002). Finally, we plot as magenta dashed line the predictions of the Planck cosmological simulation (Planck Collaboration XVI 2014).
Current usage metrics show cumulative count of Article Views (full-text article views including HTML views, PDF and ePub downloads, according to the available data) and Abstracts Views on Vision4Press platform.
Data correspond to usage on the plateform after 2015. The current usage metrics is available 48-96 hours after online publication and is updated daily on week days.
Initial download of the metrics may take a while.