Fig. 12.
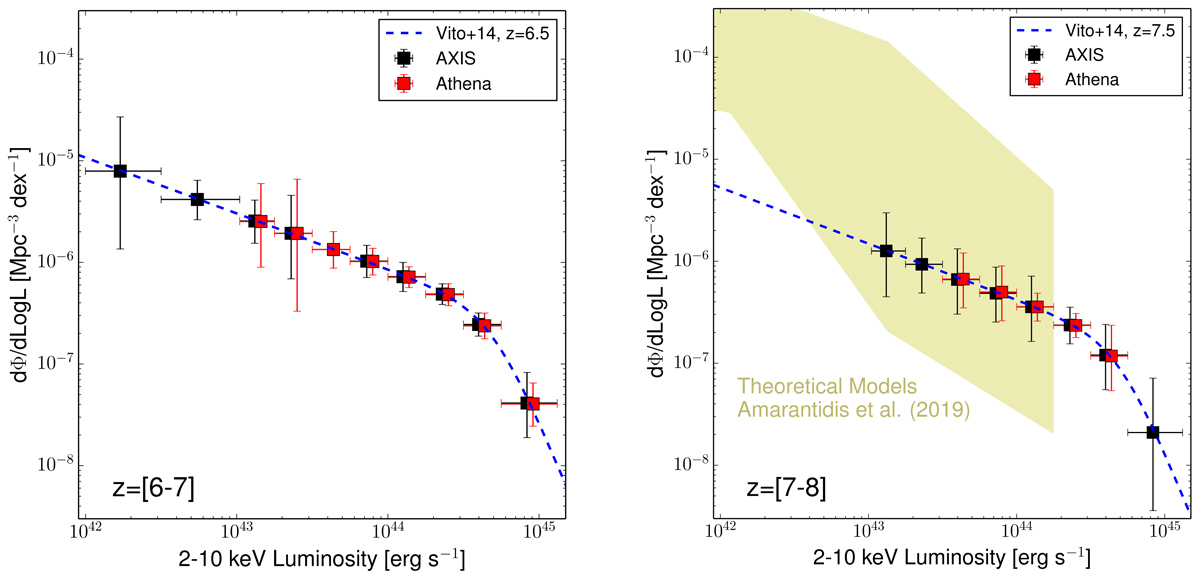
Expected X-ray luminosity function at z ∼ 6.5 (left) and z ∼ 7.5 (right), of AXIS (black) and ATHENA (red), respectively. The Vito et al. (2014) XLFs at the same redshifts are plotted as a blue dashed line and a solid cyan line, respectively. In the right panel, the range of predictions from the hydro-dynamical simulations and semi-analytical models discussed in Amarantidis et al. (2019, khaki area) is also shown for comparison.
Current usage metrics show cumulative count of Article Views (full-text article views including HTML views, PDF and ePub downloads, according to the available data) and Abstracts Views on Vision4Press platform.
Data correspond to usage on the plateform after 2015. The current usage metrics is available 48-96 hours after online publication and is updated daily on week days.
Initial download of the metrics may take a while.