Fig. 11.
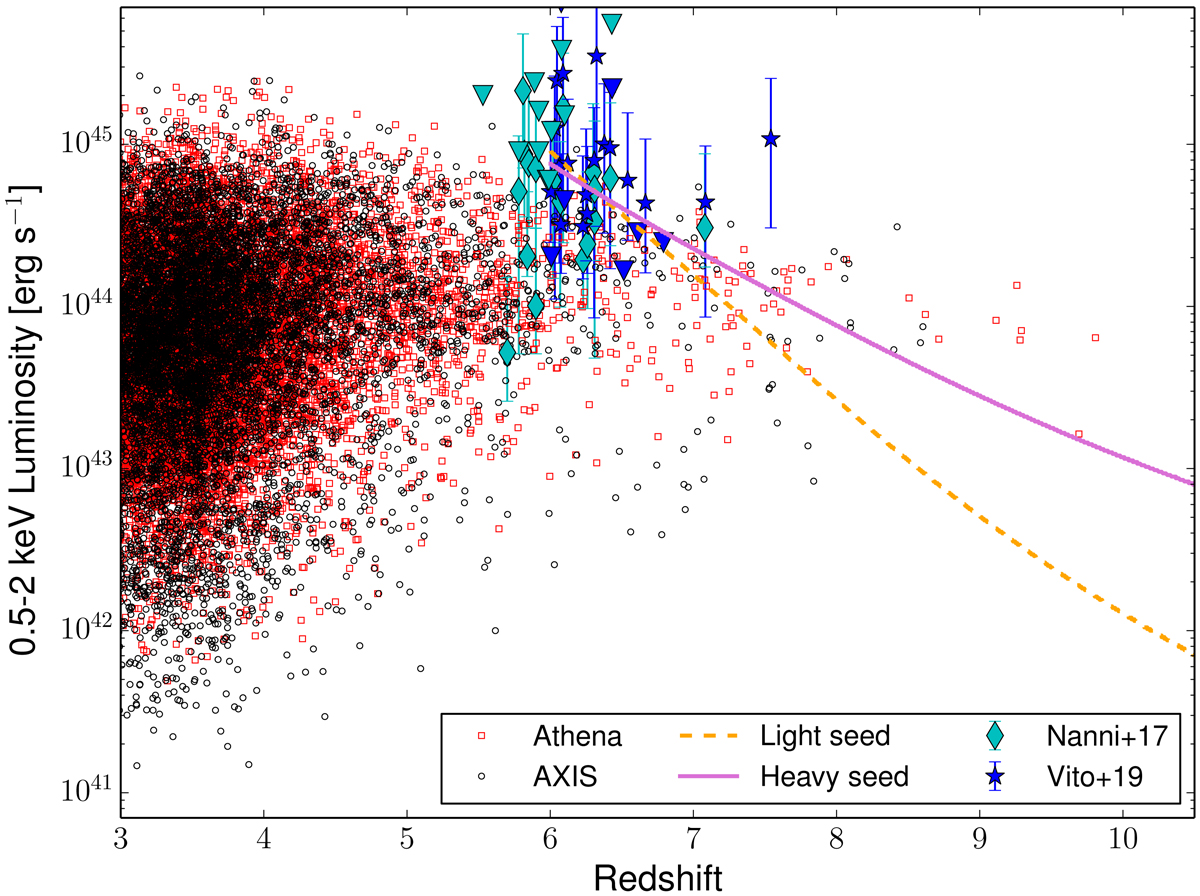
0.5–2 keV luminosity as a function of redshift for the z > 3 sources detected in the simulated AXIS (black circles) and ATHENA (red squares) surveys. 1σ uncertainties are computed using the Gehrels (1986) equations. The z > 5.5 AGNs detected in the X-rays by currently available facilities are also plot for comparison (Vito et al. 2019, blue stars; Nanni et al. 2017, cyan diamonds). Two different models of black hole seed accretion are also shown (light SMBH seed: dashed yellow line; heavy SMBH seed: solid magenta line; see the text for more details).
Current usage metrics show cumulative count of Article Views (full-text article views including HTML views, PDF and ePub downloads, according to the available data) and Abstracts Views on Vision4Press platform.
Data correspond to usage on the plateform after 2015. The current usage metrics is available 48-96 hours after online publication and is updated daily on week days.
Initial download of the metrics may take a while.