Fig. 10.
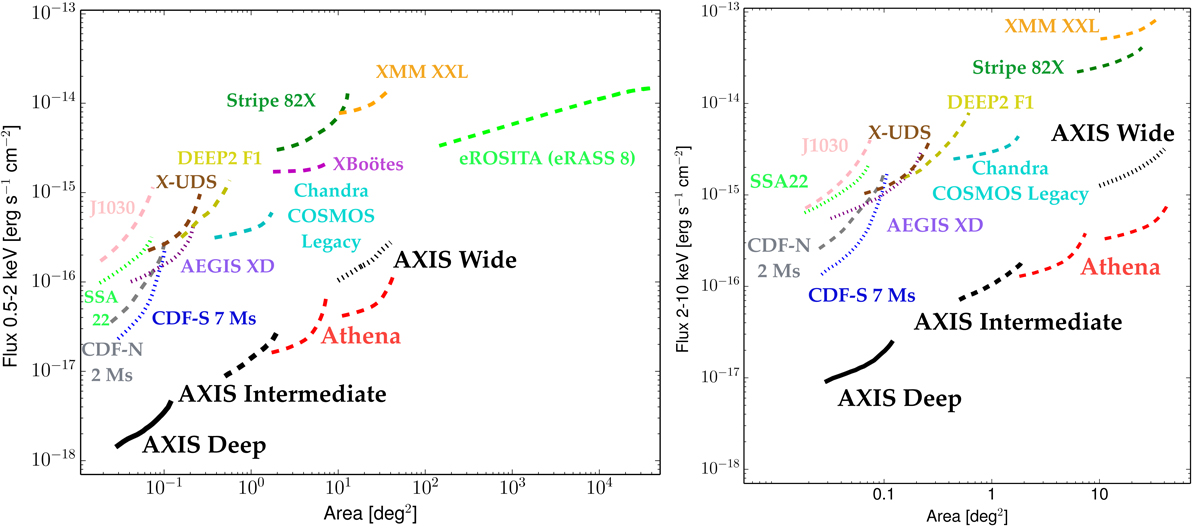
0.5–2 keV (left) and 2–10 keV (right) area-flux curves for the AXIS deep, 5 Ms (solid black line), intermediate, 300 ks (dashed black line) and wide, 15 ks (dotted black line) reference surveys. For comparison, we show the area-flux curves of several existing X-ray surveys: CDF-S 7 Ms (Luo et al. 2017, dotted blue line); CDF-N 2 Ms (Xue et al. 2016, dashed gray line); AEGIS XD (Nandra et al. 2015, dotted purple line); SSA22 (Lehmer et al. 2009, dotted light green line); XDEEP-2 F1 (Goulding et al. 2012, dashed yellow line); J1030 (dashed pink line; Nanni et al. 2020); X-UDS (Kocevski et al. 2018, dashed brown line); Chandra COSMOS Legacy (Civano et al. 2016, dashed cyan line); X-Bootes (Murray et al. 2005, dashed magenta line); Stripe 82X (LaMassa et al. 2013b,a, 2016, dashed green line); and XMM-XXL (Pierre et al. 2016, dashed orange line). We also show the predictions made for the ATHENA deep– and wide–area survey (dashed red lines; see the text for more details), and those for four years of eROSITA observations (i.e., eRASS:8; Merloni et al. 2012; Comparat et al. 2019, dashed light green line). The plotted lines have been derived from the 0.5–2 keV survey sensitivity curves in an area range that starts at 20% and stops at 80% of the area covered by the survey.
Current usage metrics show cumulative count of Article Views (full-text article views including HTML views, PDF and ePub downloads, according to the available data) and Abstracts Views on Vision4Press platform.
Data correspond to usage on the plateform after 2015. The current usage metrics is available 48-96 hours after online publication and is updated daily on week days.
Initial download of the metrics may take a while.