Fig. 5
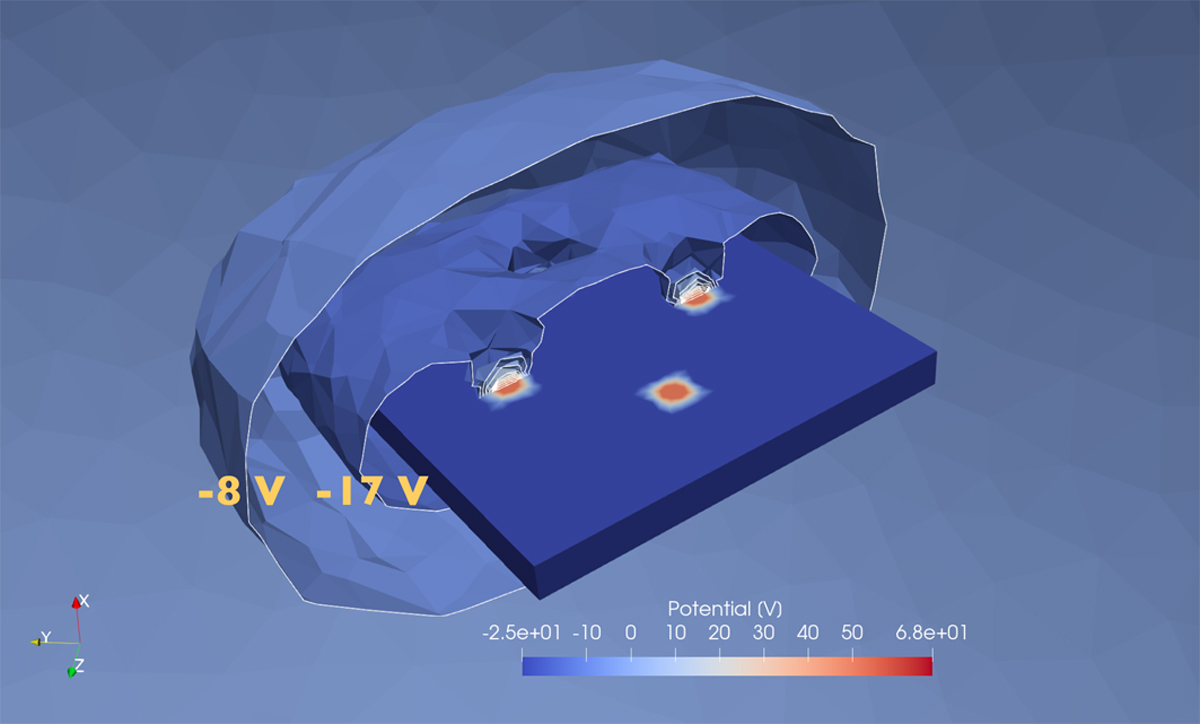
Visualisation of electrostatic potential struture from a SPIS simulation of a model with four 0.1 × 0.1 m +75V biasedelements on a 1.25 × 1.25 × 0.15 m solar panel inside a spherical simulation volume of radius 15 m. Ten equipotential surfaces (cut in the Y = Z plane) from −17 V to +42.5 V are also plotted with the −8 V and −17 V surfaces specifically labelled.
Current usage metrics show cumulative count of Article Views (full-text article views including HTML views, PDF and ePub downloads, according to the available data) and Abstracts Views on Vision4Press platform.
Data correspond to usage on the plateform after 2015. The current usage metrics is available 48-96 hours after online publication and is updated daily on week days.
Initial download of the metrics may take a while.