Fig. 2
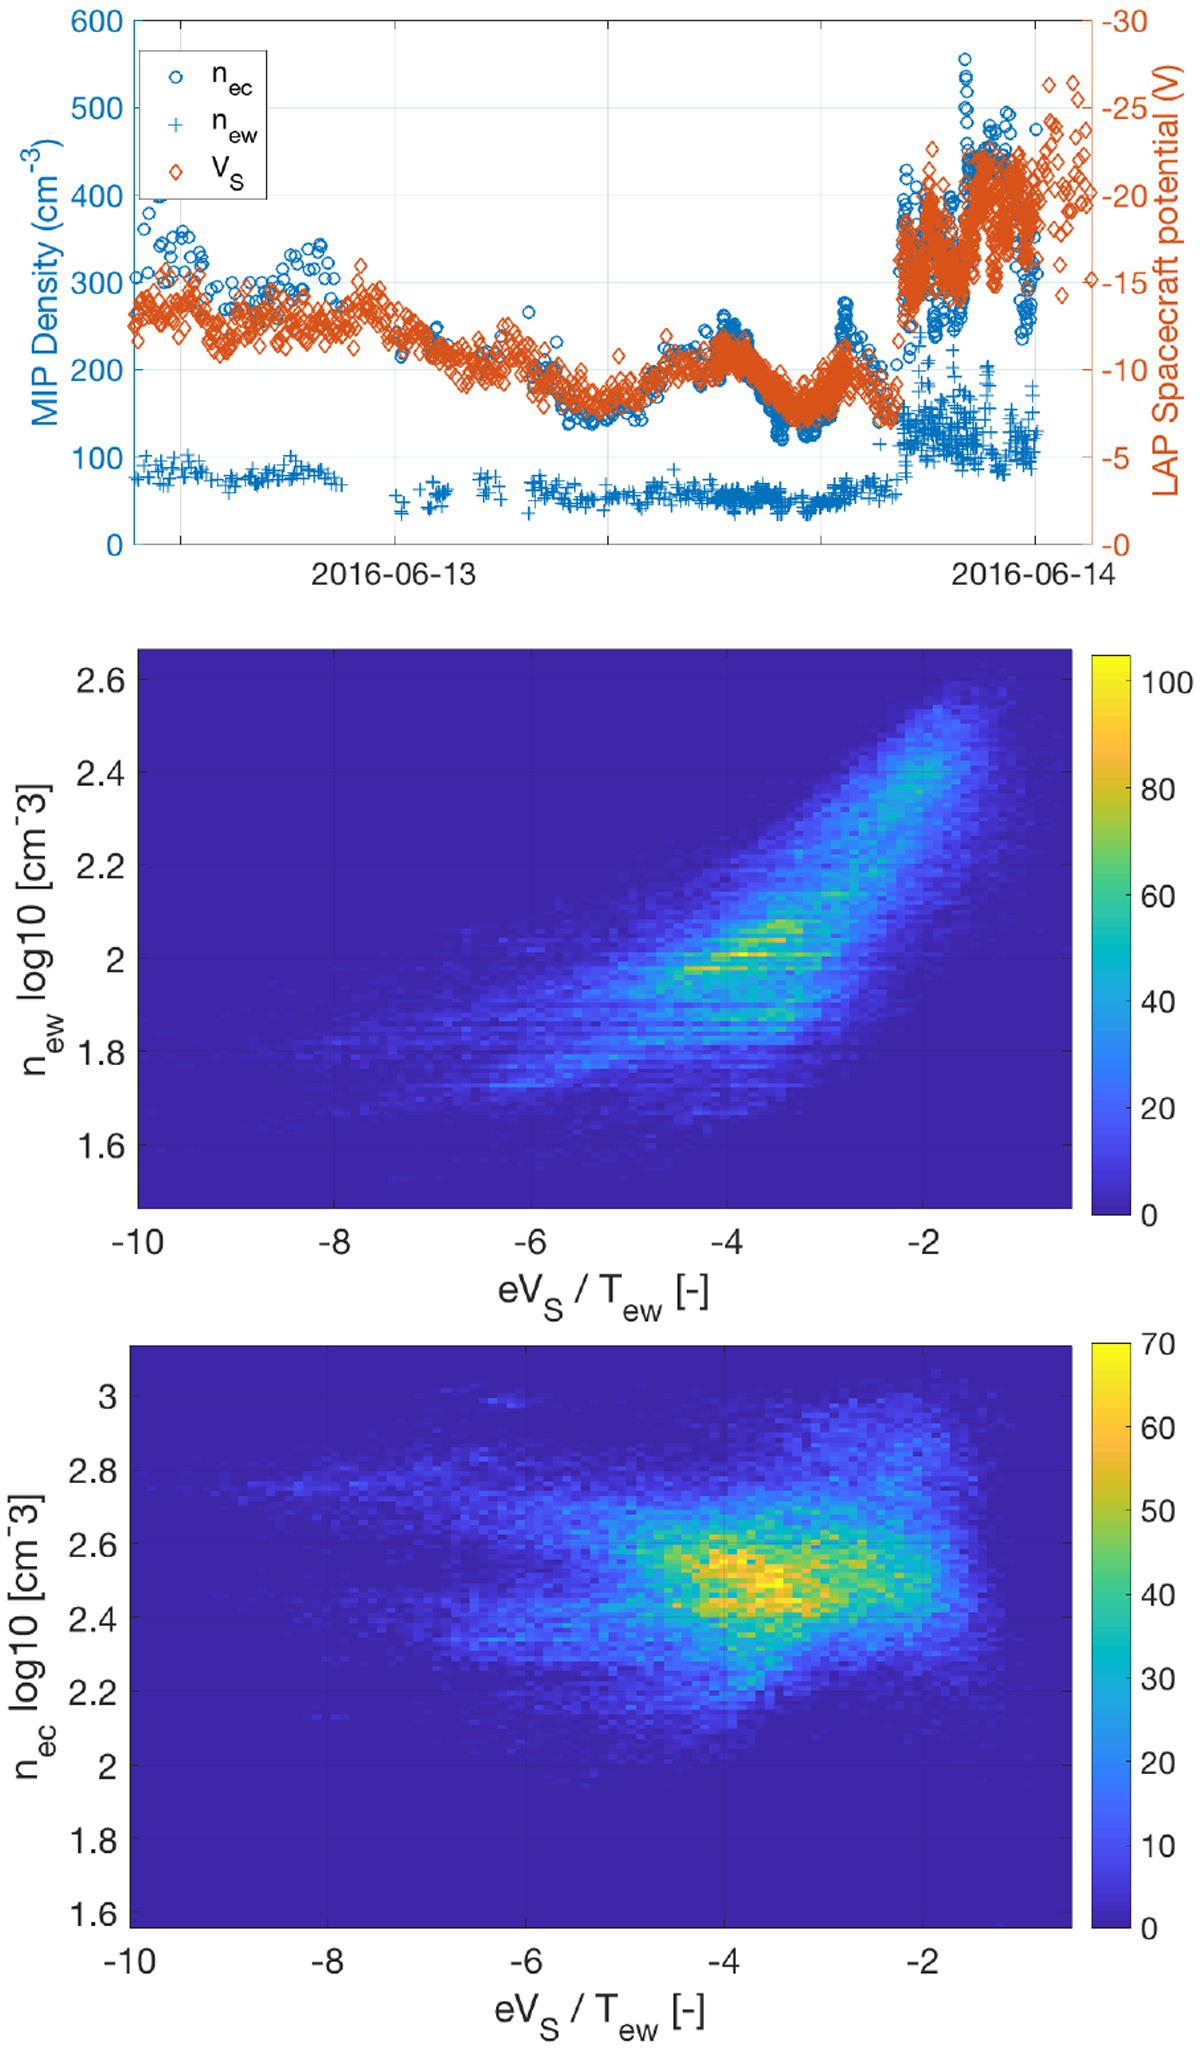
Top: example time series of LAP spacecraft potential (diamonds), cold (circles), and warm (pluses) electron density estimates from MIP in the same interval, exhibiting the strong correlation between spacecraft potential and cold electron density. Middle: same data as shown in Fig. 1, 2D histogram of 120 × 150 bins of new vs. eVS ∕Tew. Bottom: as above, but with nec on the y-axis.
Current usage metrics show cumulative count of Article Views (full-text article views including HTML views, PDF and ePub downloads, according to the available data) and Abstracts Views on Vision4Press platform.
Data correspond to usage on the plateform after 2015. The current usage metrics is available 48-96 hours after online publication and is updated daily on week days.
Initial download of the metrics may take a while.