Fig. 9.
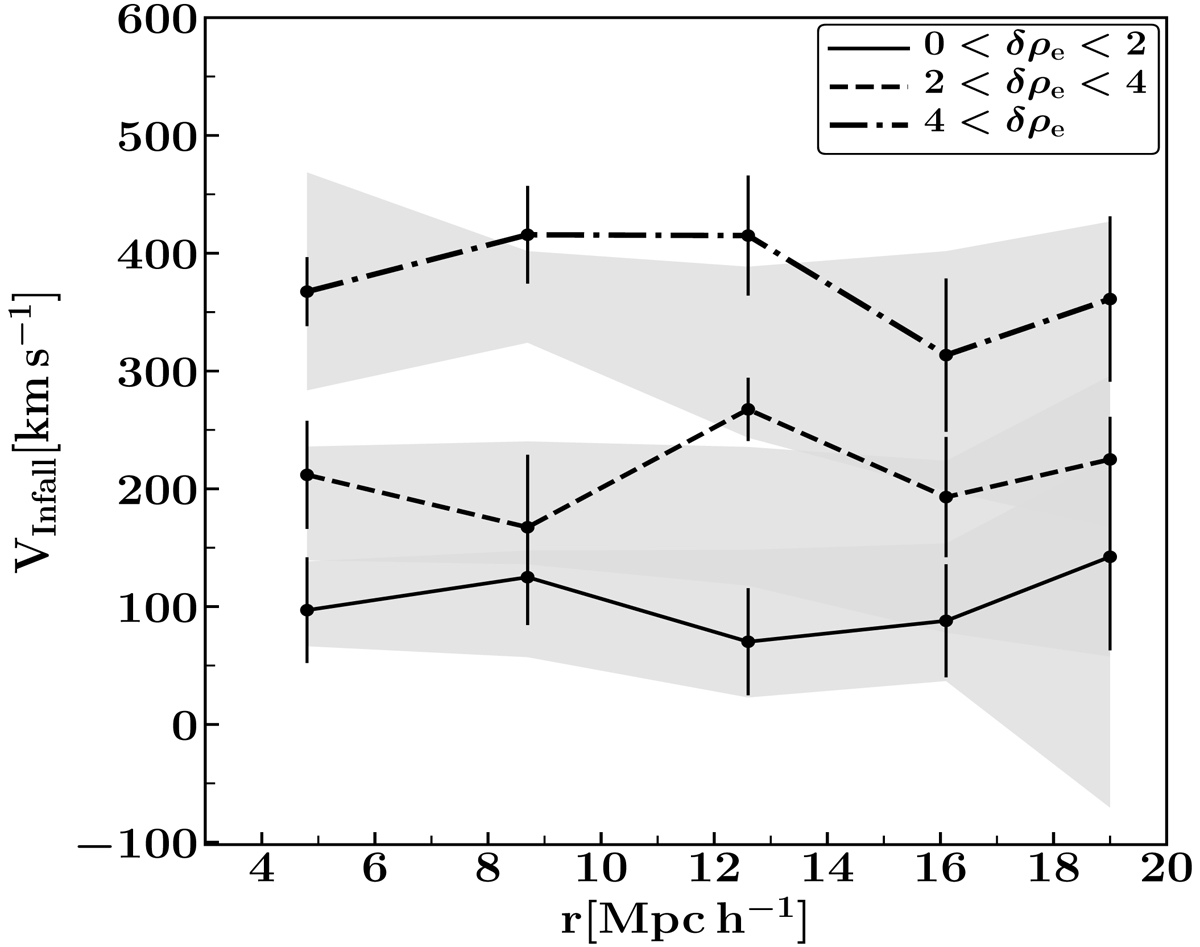
Dependence of infall onto groups from regions with different density environments in observational data. The lines correspond to the mean infalling velocity onto groups embedded in regions with δρe > 4 (dot–dashed), 2 < δρe < 4 (dashed), and 0 < δρe < 2 (solid). The three gray shaded regions represent the variance from equivalent high-, medium-, and low-density environments in the mock catalogs, respectively. Error bars correspond to the uncertainties in the derived mean infalling velocities.
Current usage metrics show cumulative count of Article Views (full-text article views including HTML views, PDF and ePub downloads, according to the available data) and Abstracts Views on Vision4Press platform.
Data correspond to usage on the plateform after 2015. The current usage metrics is available 48-96 hours after online publication and is updated daily on week days.
Initial download of the metrics may take a while.