Free Access
Fig. 7.
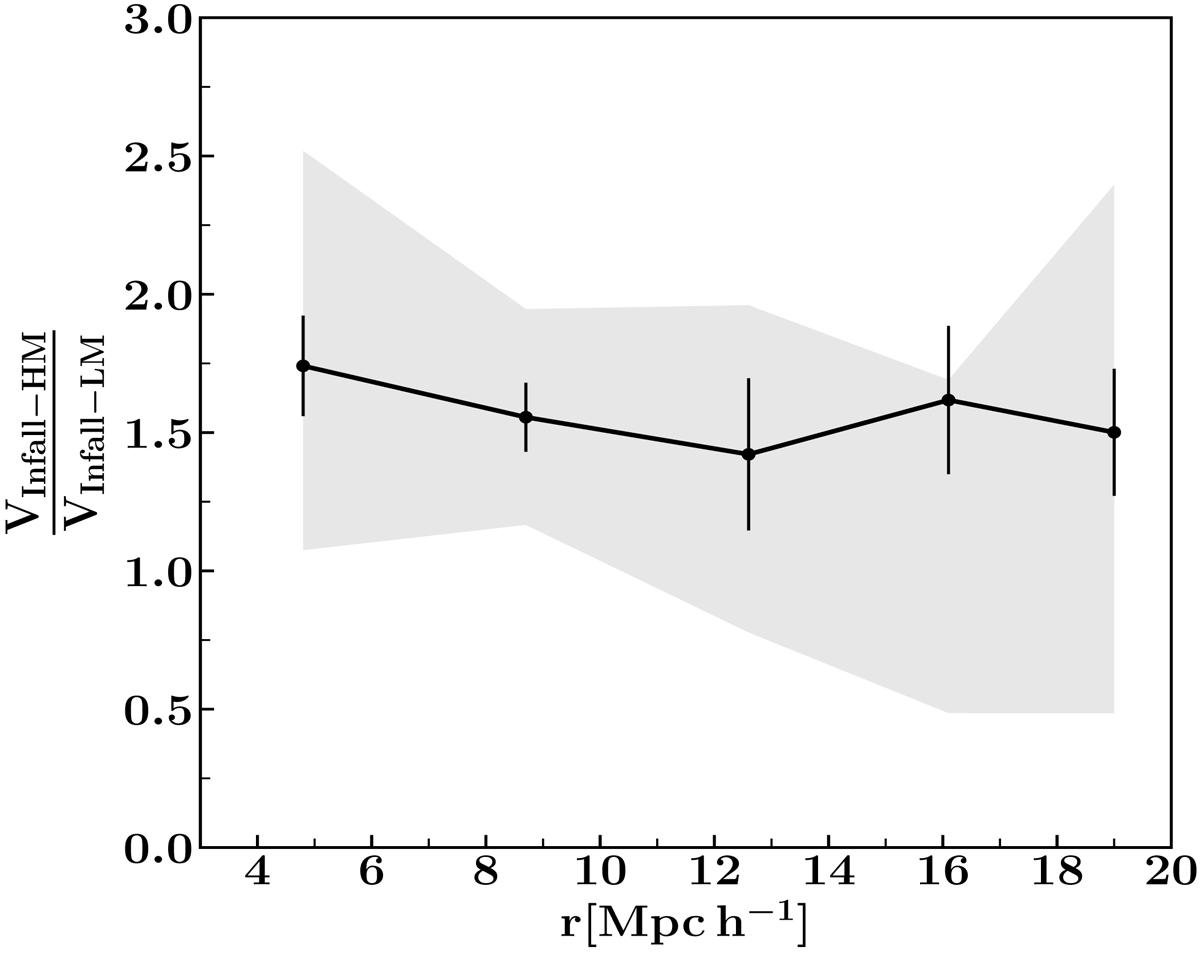
Ratio of the mean infall velocity of high-to-low-mass groups as a function of distance to the group centers in observational data (solid line). Error bars indicate the uncertainty in the mean infall velocity, and the gray shadow region shows the dispersion of 25 mock catalogs.
Current usage metrics show cumulative count of Article Views (full-text article views including HTML views, PDF and ePub downloads, according to the available data) and Abstracts Views on Vision4Press platform.
Data correspond to usage on the plateform after 2015. The current usage metrics is available 48-96 hours after online publication and is updated daily on week days.
Initial download of the metrics may take a while.